


Abstract
Parkinson’s disease (PD) is a common, adult-onset, neuro-degenerative disorder characterized by the degeneration of cardinal motor signs mainly due to the loss of dopaminergic neurons in the substantia nigra. To date, researchers still have limited understanding of the key molecular events that provoke neurodegeneration in this disease. Here, we present ParkDB, the first queryable database dedicated to gene expression in PD. ParkDB contains a complete set of re-analyzed, curated and annotated microarray datasets. This resource enables scientists to identify and compare expression signatures involved in PD and dopaminergic neuron differentiation under different biological conditions and across species.
Database URL:http://www2.cancer.ucl.ac.uk/Parkinson_Db2/
Introduction
Parkinson’s disease (PD) is both sporadic and genetic (5–10%) (1). Although several mutated loci have been identified, they appear to be directly responsible in only a relatively small number of families. Evidence is accumulating, however, that the molecular pathways underlying these genomic regions may be common to more than one genetic form of Parkinsonism and may also play a role in the common sporadic disease (2, 3). Causes of sporadic PD are unknown but a prevalent hypothesis is that it may result from a complex interaction between toxic environmental factors, genetic susceptibility and aging (4).
Despite the fact that several gene expression studies focused on PD have been performed (5–14), no database has been developed to allow full-scale meta-analysis of microarray data related to PD.
Here, we present ParkDB, a resource that aims to provide comprehensive access to high quality gene expression datasets analyzed in a homogeneous manner. ParkDB has three main functions:
To collect all microarray data from publicly available sources such as ArrayExpress (15), Gene Expression Omnibus (GEO) (16) and the Stanford microarray database (17), pertaining to PD and to dopaminergic neuron differentiation.
To provide access to key differentially expressed genes across different experiments contained in the database (i.e. different tissues, cell lines, treatments and species).
To provide homogeneous results from the statistical analysis of microarray data allowing for effective comparisons between experiments.
Database schema and content
Data model
ParkDB is a relational database. The entity relationships between these tables are depicted in Figure 1. The conceptual scheme described was designed to facilitate the inclusion of new experiments and associated gene annotations in future updates.
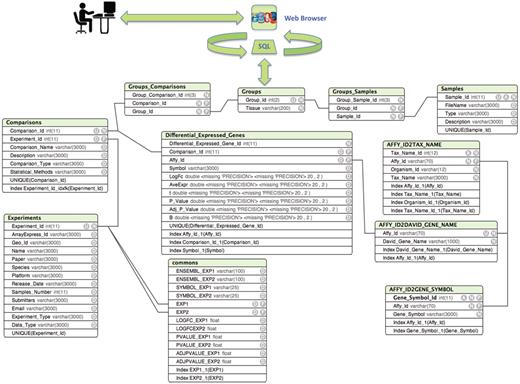
Entity relationship diagram of ParkDB. The scheme illustrates the tables created for data storage with the respective attributes and relations. The simple relations between the tables facilitate the possible expansion of the database to other genes involved in PD neurodegeneration and dopaminergic differentiation.
ParkDB includes microarray data from human diseased brain areas and other tissues, as well as mouse, rat and zebrafish samples pertaining to PD affected tissues, PD animal models and PD-related experiments (Figure 2). Moreover, it also contains further annotation data associated to the genes identified and their orthologues. In total, more than 800 Affymetrix chips were re-analyzed.
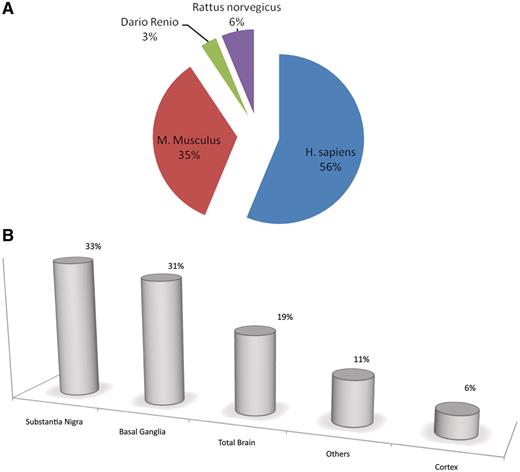
Pie charts and bar plot representing the curated information for each biological tissue, organism and comparison. Fifty-six percent of resources are retrieved from human experiments, 35% from mouse, 6% from rat and the remaining 3% from zebrafish. (A). Thirty-three percent of the tissues included in ParkDB were obtained from substantia nigra, 31% from basal ganglia, 19% from the whole brain, 6% from different regions of cortex and 11% from different tissues such as Blood, B Lymphocytes, etc. (B).
Data insertion process
We download manually the raw data from GEO, ArrayExpress and Stanford databases every 2 months and re-analyze/re-annotate them using an automatic script written in R, which already contains annotation for all the Affymetrix platforms. Since ParkDB is built directly from raw data it is not affected by changing formats or data models of the databases we obtain the data from. Furthermore, researchers are invited to contact us to directly upload their data into ParkDB.
Queries
The ParkDB database allows the user to mine the data in the following ways:
The ‘gene query’ can be performed by typing the NCBI gene name, the gene symbol, the Affymetrix probe identifier or the chromosome on which the gene is located. The resulting output view provides details on organism name, Affymetrix probe id, the description of each experiment where the gene was found to be differentially expressed at chosen cut-off, and the differential expression values (i.e. log2 fold-change, t-test value, adjusted P-value, Bayesian value for t) (Figure 3).
The ‘experiment query’ allows searching for a specific experiment by names/keywords. In this case, a brief description table will be visualized alongside a list of all the genes, which were found to be differentially expressed (Supplementary Figure S1).
The ‘tissue query’ allows the researcher to search for specific tissue/cell types that may have been used in more than one experiment and retrieve the differentially expressed genes relating to those specific contrasts (Supplementary Figure S2).
The ‘comparison query’ provides a unique data-mining feature that has been made possible because of the homogeneous analysis of the expression data available in ParkDB. Since we have incorporated information on orthology, the researcher can query the database for common genes between two experiments and across different organisms. The resulting view will also highlight whether the genes were found to be up-regulated, down-regulated or anti-correlated, in two different comparisons (Figure 4).
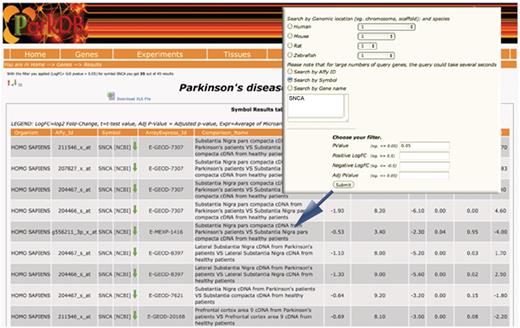
Gene query. The table shows the differential expressed genes obtained searching for SNCA. Red and green arrows indicate, respectively, up- and down-regulation.
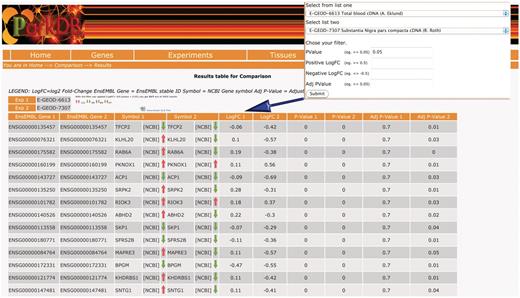
Comparison query. The table shows the common genes obtained comparing substantia nigra from PD patients and a transgenic mice that over-expresses HSP70/SNCA. The resulting view also highlights whether the genes were found to be up-regulated/down-regulated or anti-correlated, in two different comparisons.
Usage example
One of the most useful functions of ParkDB is the possibility to retrieve expression values for a particular gene in different experiments. For example, by querying ParkDB for gene symbols, we found that α-synuclein (SNCA) is differentially expressed and down-regulated in the entire set of human experiments comparing substantia nigra from Parkinson’s patients against normal controls. SNCA is expected to be up-regulated in PD patients because it codes for a protein that forms Lewy bodies, which are the hallmark of PD.
This apparently inconsistent result can be explained by the fact that total mRNA was extracted from the remaining, more resistant neurons in post-mortem PD samples. Furthermore, Seo et al. (18) suggested a protective property for alpha-synuclein at low levels. They found that at nanomolar concentration alpha-synuclein protects rat cortical and hippocampal neuronal cells against serum deprivation and oxidative stress. This process is mediated by the Akt2 signaling pathway and its protective effect is increased by Bcl-2 overexpression. This study seems to confirm our results that show an up-regulation of BCL-2/AKT2 in human experiments comparing substantia nigra from Parkinson’s patients against normal samples (Table 1) leading to the hypothesis that the anti-apoptotic effect of this pathway in the remaining cells of substantia nigra samples might represent a system that protects dopaminergic neurons from cell death. Moreover, higher BCL-2 levels in Alzheimer’s disease are thought to be related to a compensatory up-regulation in response to the neurodegenerative process (19). Our findings might indicate that the expression profiling of post-mortem tissue from PD patients represents a specific signature of surviving neurons. The down-regulation of SNCA and other genes, however, might also be related to a significant limitation of post-mortem tissue, and/or reflect neuron loss and replacement by glia cells.
Gene expression table. SNCA (down-regulated), BCL2 (up-regulated) and AKT (up-regulated) are significant differentially expressed comparing substantia nigra in PD patients against normal control using ParkDB datasets
| Gene name | Fold-change | Average expression value | P-value |
|---|---|---|---|
| SNCA | 2.06 (down-regulated) | 7.26 | 0.02 |
| BCL2 | 1.82 (up-regulated) | 6.25 | 0.01 |
| AKT2 | 1.36 (up-regulated) | 5.79 | 0.01 |
| Gene name | Fold-change | Average expression value | P-value |
|---|---|---|---|
| SNCA | 2.06 (down-regulated) | 7.26 | 0.02 |
| BCL2 | 1.82 (up-regulated) | 6.25 | 0.01 |
| AKT2 | 1.36 (up-regulated) | 5.79 | 0.01 |
Data sources
We downloaded raw gene expression data from publicly available sources such as ArrayExpress, GEO and Stanford database. ArrayExpress is a repository of microarray data where files are both uploaded directly by researchers and imported from GEO. It is regularly queried for experiments based on keywords pertaining to PD and/or dopaminergic neuron differentiation. All the experiments which we import from ArrayExpress have passed their basic quality control (i.e. the raw data has to be available and no data files should be corrupted). In a few selected cases, we import directly data that is missing from Arrayexpress because it was uploaded on a project/publication specific website or obtained directly from the scientists involved. In that case, we perform this basic QC ourselves.
Using biomaRt (20) we were able to retrieve ortholog gene information from the Ensembl database (21) enabling users to perform inter-species queries. In order to allow among class comparisons (CC), we mapped all the CC genes using Ensembl Gene identifiers (EGIs). If an EGI was repeated in a single class comparison, we grouped them by considering the average, maximum, standard deviation of fold-change and the minimum adjusted P-value. Moreover, given two CCs, we provided the list of the genes measured in both the comparisons and, for each gene we provided the fold-change and the adjusted P-value. If both CCs were related to the same organism, we searched for those Ensembl identifiers that were included in both CCs, alternatively the ortholog gene identifier was used. Term annotations were derived from controlled vocabularies (22, 23).
Statistical methods
Analysis of all the microarray data incorporated in the database was performed using LIMMA (24), a Bioconductor (25) package for the R statistical programming language (http://www.r-project.org). The statistics employed by this package is based on the RMA method that provides quantile normalization, a linear transformation and a Bayesian t-test. The concept of using a t-statistic with a Bayesian adjusted denominator after a linear model transformation was first proposed by Smyth et al. (26). Each experiment was analyzed separately and no cross-experiment or cross-platform analyses were performed. This was done in order to avoid the limitations of source differences and batch effects. The comparison page allows the user to identify which genes have shown significant expression change across different experiments, but those values are derived from an analysis performed within each experiment separately.
Conclusions
ParkDB is the first database, which has collated, curated and re-analyzed the microarray data pertaining to samples from PD and dopaminergic neuron differentiation in a homogeneous manner.
It provides a unique combination of features that allow the researcher to perform data analysis and discovery of relationships between genes involved in PD in several human brain regions, as well as across multiple model organisms or cell lines.
Its strength lies in the careful re-analysis of all experiments, which ensures that the statistical basis for defining genes as differentially expressed is comparable. The goal of this study is to offer the researcher a central repository to perform meta-analysis queries.
By using the ‘comparison’ feature a researcher can easily download lists of genes, which are differentially expressed across tissues, cell lines, treatments and organisms, along with comparable and reliable statistical parameters for each gene in each experiment.
ParkDB will be regularly updated allowing the data to be refined continuously with every new ArrayExpress, GEO and Stanford microarray database version.
Further directions
Future improvements of ParkDB will allow the inclusion of next-generation sequencing data to fully exploit the relationship between microarray gene expression and deep-sequencing data in PD.
Funding
DOPAMINET project (www.dopaminet.org) founded by European Commission FP7 program (grant agreement number 223744).
Conflict of interest. None declared.
Acknowledgements
The authors gratefully acknowledge the support and help of Jacek Marzek, Cristina Leonesi and all the members of DOPAMINET.
This is a newer version of this manuscript. The previous version contained errors in the author list, which has now been corrected.
References
Author notes
The authors wish it to be known that, in their opinion, the first two authors should be regarded as joint First Authors.
