


Abstract
Phenol-Explorer, launched in 2009, is the only comprehensive web-based database on the content in foods of polyphenols, a major class of food bioactives that receive considerable attention due to their role in the prevention of diseases. Polyphenols are rarely absorbed and excreted in their ingested forms, but extensively metabolized in the body, and until now, no database has allowed the recall of identities and concentrations of polyphenol metabolites in biofluids after the consumption of polyphenol-rich sources. Knowledge of these metabolites is essential in the planning of experiments whose aim is to elucidate the effects of polyphenols on health. Release 2.0 is the first major update of the database, allowing the rapid retrieval of data on the biotransformations and pharmacokinetics of dietary polyphenols. Data on 375 polyphenol metabolites identified in urine and plasma were collected from 236 peer-reviewed publications on polyphenol metabolism in humans and experimental animals and added to the database by means of an extended relational design. Pharmacokinetic parameters have been collected and can be retrieved in both tabular and graphical form. The web interface has been enhanced and now allows the filtering of information according to various criteria. Phenol-Explorer 2.0, which will be periodically updated, should prove to be an even more useful and capable resource for polyphenol scientists because bioactivities and health effects of polyphenols are dependent on the nature and concentrations of metabolites reaching the target tissues. The Phenol-Explorer database is publicly available and can be found online at http://www.phenol-explorer.eu.
Database URL:http://www.phenol-explorer.eu
Introduction
Polyphenols are secondary plant metabolites abundant in many plant foods (1). An average dietary intake of 1–2 g/day has been reported in several Western populations with fruits and beverages such as tea, coffee, wine and fruit juices recognized as the major dietary sources (2, 3). Polyphenols have long been known to exert a range of biological activities, and their intake has been associated with a reduced risk of chronic diseases, such as coronary heart disease, stroke, type 2 diabetes and some cancers in various epidemiological studies and clinical trials (4–6). For this reason, they are now regarded as important components of a healthy diet and are thought to be partly responsible for the health benefits of an increased fruit and vegetable consumption (7). They may also explain the protective effects of tea against cardiovascular diseases (8, 9) or of coffee against type 2 diabetes (10). In the last 15 years, scientific and commercial interest in polyphenols has grown dramatically, and several thousand studies investigating their bioactivities, metabolism and health effects are published every year.
Since its launch in 2009, the first release of Phenol-Explorer (Phenol-Explorer 1.0) has aided such research with its ability to generate an instant estimate of the polyphenol composition of a queried food, based on data from as many quality-assessed publications as possible (11). Similarly, it was possible to search for a phenolic food component and retrieve all foods in which this polyphenol had been identified, along with average concentrations. This ease of data retrieval and comprehensive aggregation of studies have made the database a unique and essential tool for polyphenol scientists.
A detailed knowledge of the bioavailability of the various polyphenols and the nature and concentrations of the metabolites formed in the body is also essential to understand their effects on health. Most polyphenols are glycosylated in foods and are deglycosylated in the brush border of the small intestine or by colonic microbiota and re-conjugated to water-soluble glucuronides and sulfate esters and methylated in the intestine and the liver (12). Conjugated metabolites are then rapidly eliminated in the bile and urine. Polyphenols not absorbed in the small intestine are metabolized by the microbiota in the colon to a variety of low-molecular-weight phenolic acids, which may be absorbed into systemic circulation.
Knowledge of polyphenol metabolism has grown considerably during the past decade, but data are inherently difficult to search for and place into context because of the variable nature of doses, study organisms and time scales used in experimental studies. This information is still scattered in a large number of scientific publications, and its analysis often requires laborious searches, and no dedicated database has been available so far. More general databases contain scattered information on polyphenol metabolism; for example, the Human Metabolome Database (http://www.hmdb.ca) contains data on some polyphenols and gives example concentrations of the parent compound in biofluids as observed after the consumption of a few selected foods (13). Also, the Kyoto Encyclopedia of Genes and Genomes (http://www.genome.jp/kegg/) contains information on some polyphenol metabolites (14). However, a large number of known polyphenol metabolites are missing from these databases, and the identities of phase II conjugates of a given polyphenol are not listed. Detailed pharmacokinetic data on these compounds are not available.
Here, we report the second major release of Phenol-Explorer (Phenol-Explorer 2.0), which extends the utility of the database by allowing the retrieval of information pertaining to the in vivo metabolism and pharmacokinetics of dietary polyphenols. The database now includes identities of all known plasma and urinary polyphenol metabolites together with detailed pharmacokinetic data. All food sources that have been reported to give rise to one of these metabolites can be retrieved. Finally, the results of these searches are accompanied by detailed pharmacokinetic data [maximum plasma concentration (Cmax), time to reach Cmax (Tmax), area under concentration-time curve (AUC), half-life of elimination (T1/2), urinary recovery and plasma or urinary time courses where available. Searches are made through the existing user-friendly and intuitive web interface, and metabolism data are linked to food composition data. We believe that this new release will be the most powerful and useful resource to easily identify those polyphenol metabolites and respective concentrations most relevant for future experimental research or most useful as biomarkers of exposure for future epidemiological studies.
A limit of our current knowledge is that much of the evidence on the role of polyphenols in the prevention of chronic diseases arises from clinical trials where complex polyphenol-rich foods were administered (6). More data on the properties and effects of individual polyphenols are clearly needed, and this implies the collection and use of detailed information on food composition and polyphenol metabolism, as well as new clinical trials with pure polyphenol supplements (15).
Compilation of data and implementation of the update
A systematic search was performed for literature on polyphenol metabolism, published up until 1 March 2011. Search terms were built from a template that included the biofluid analyzed, the selected animal or human species and the names of the polyphenols and polyphenol classes of interest (Table 1), and these were applied in parallel to three databases: the Cochrane Library (from 1800; www.thecochranelibrary.com), MEDLINE Pubmed (from 1950, www.pubmed.org) and the ISI Web of Knowledge Science Citation Index Expanded (1945 to present). The publications retrieved were compiled and organized using Endnote (Thomson Reuters, New York, NY).
Search strategy and terms
| Search steps | Search terms | Number of publications |
|---|---|---|
| 1 | urin* or plasma* or metabol* | >100 000 |
| 2 | Dietary intake or intake* or exposure* or consum* or supplementation* or dietary supplements or supplement* or intervention study or experiment* or exp clinical trial or interven* or feasibility study or pilot study | >100 000 |
| 3 | Human* or volunteer* or participant* or subject* or rat* or mouse* or mice* or rabbit* or pig* or sheep* or ewe* or dog* | >100 000 |
| 4 | Polyphenol* or flavan* or flavon*or anthocyan* or isoflav* or phytoestrogen* or phyto-estrogen* or lignin* or stilbene* or chalcon* or phenolic acid* or ellagic* or coumarin* or hydroxycinnamic* or quercetin* or kaempferol* or rutin* or apigenin* or luteolin* or catechin* or epicatechin* or gallocatechin* or epigallocatechin* or procyanidin* or hesperetin* or naringenin* or cyanidin* or malvidin* or petunid* or peonid*or daidz* or genist* or glycit* or equol* or gallic* or vanillic* or chlorogenic* or tyrosol* or hydoxytyrosol* or resveratrol* or viniferin* | >100 000 |
| 5 | Steps 1–4 combined | 10 780 |
After the screening of titles and abstracts, reviews, in vitro studies and any duplicates were excluded (Figure 1). Of the remainder, full-text articles were obtained for more detailed analyses. Articles were subsequently included or excluded according to various criteria. For inclusion, studies needed to (i) be conducted in vivo on humans or animals; (ii) be intervention studies using a single or repeated dose of a normal food source, an experimental food or an oral supplement; (iii) use an appropriate analytical technique, preferably mass spectrometry, capable of reliably identifying metabolites; (iv) detect or quantify at least one polyphenol metabolite in urine or plasma; (v) use disease-free humans or animals as subjects; (vi) present data in a usable format and (vii) be published in English. In addition, some articles were rejected at the compilers’ discretion due to a lack of clarity or essential information or due to an excessively complex study design. Finally, only metabolites with fully defined structures were included; for example, data on quercetin 3-glucuronide would be included but not, for example, quercetin glucuronide, as quercetin may be glucuronidated at different positions on the phenolic rings.
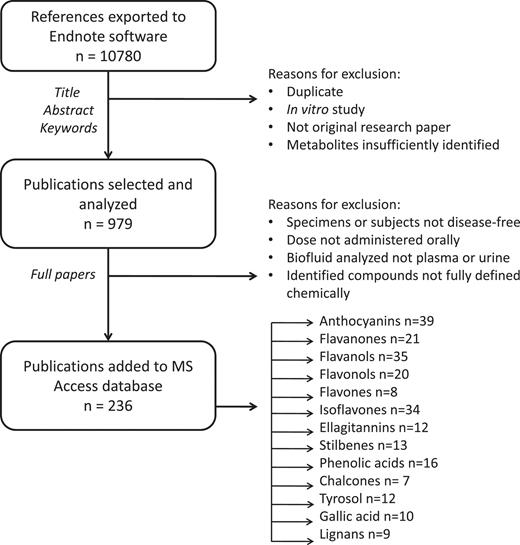
Scheme showing process of literature review and data inclusion.
As with Phenol-Explorer 1.0, data were compiled by means of a Microsoft Access database. The physical design of Phenol-Explorer 1.0 consisted of five main tables (4). Four of these were independent tables named Foods, Publications, Compounds and Methods, whose records were allocated autonumbers. A fifth table, Food Composition, listed each concentration value collected as a record, accompanied by codes linking to the food, publication, polyphenol quantified and method of analysis. To incorporate metabolism data, two extra tables were added (Figure 2). The Interventions table lists every separate intervention experiment, defined as a combination of the dose type, dose quantity and organism. Interventions table is linked, by many-to-one relationships, to Foods and Publications. The Biofluid Composition table lists concentration values of metabolites in plasma or urine and detailed temporal data. Biofluid Composition is linked by many-to-one relationships with Interventions, Compounds and Methods. The following is a description of each of the seven tables and their contents.
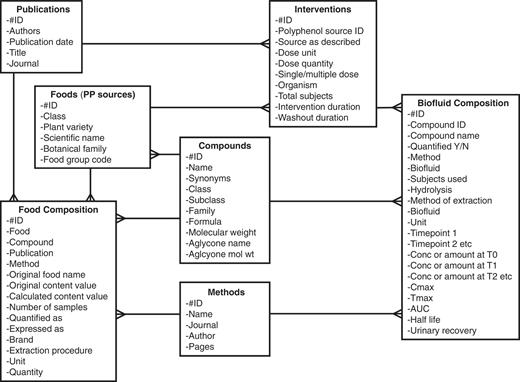
Entity-relationship diagram of the Phenol-Explorer 2.0 database showing new tables.
Foods
In the Phenol-Explorer 1.0 release, the table only contained foods representative of those regularly consumed in various populations. For Phenol-Explorer 2.0, experimental foods specific to a particular intervention study, such as polyphenol-rich extracts, enzymatically modified foods or pure polyphenol preparations, have been added.
Compounds
Fully defined polyphenol metabolites described in the intervention studies were added to this table. Compound classification was left unchanged from Phenol-Explorer 1.0, although an extra class to include non-phenolic breakdown products was added.
Publications
Bibliographic details for intervention studies were added to this table.
Methods
Methods of analysis for metabolites in intervention studies were classed as high performance liquid chromatography, liquid chromatography–mass spectrometry or gas chromatography–mass spectrometry with or without enzymatic hydrolysis before analysis, giving a total of six methods. Polyphenol metabolites are often analyzed after enzymatic hydrolysis to group together glucuronide and sulphate esters and simplify the chromatograms.
Food composition
If the polyphenol composition of the dose was specified in the publication, it was entered in this table in the same way as for the food composition data. Polyphenol compositions of experimental foods and supplements were entered in addition to those of normal foods. Compounds that were not precisely chemically defined were omitted. Food composition data from metabolism studies were not aggregated with existing data from the first release used to produce mean polyphenol content values in foods but were kept separate for display with individual intervention studies.
Interventions
Studies carried out in each publication were split into separate interventions, each being a combination of a dose type or source, dose quantity administered and organism. All aspects of the intervention study design as described in the publication were recorded, such as information on number of subjects/animals, doses (multiple or single) and duration of intervention.
Biofluid composition
This table is analogous to the Food composition table, and each record corresponds to one metabolite detected or quantified in the intervention study. Each record contains information on the metabolite as described, a numeric identifier based on the polyphenol class and subclass, the analytical method used, details of sample preparation and any enzymatic hydrolysis, a plasma or urinary time course with up to six time points (baseline and five subsequent time points of any duration), Cmax, Tmax, T1/2, AUC and urinary recovery. Biofluid composition data were extracted from the text, tables and figures of each publication.
The MS Access database was finally exported to a MySQL database, which is able to feed the web interface. The Phenol-Explorer site is built in the Ruby on Rails (RoR) framework (http://www.rubyonrails.org). RoR employs the Model-View-Controller design pattern and allows the construction of a reliable and responsive web application. The publicly accessible Phenol-Explorer 2.0 web server runs from an Apache 2 web server on a Debian Linux system.
Querying and output
Metabolism information is retrieved in the same way as food composition information, although searches have been enhanced and refined. The ‘simple search’ has been retained from the first release and allows the entry of terms into a search box in the top-right hand corner of any page on the site. When a search term, i.e. a name of a food, polyphenol or polyphenol metabolite, is entered, a list of matching items is displayed in the form of boxes, which contain links to data. For example, if ‘wine’ is typed, eight matching foods and four matching food groups are displayed. These boxes are visually oriented and contain photographs of foods or chemical structures for phenolic compounds, and more detailed data are accessed by hyperlinks. In the first release, food boxes contained the links ‘show polyphenol content’ and ‘show polyphenol distribution’. For the second release, these are now supplemented with ‘show metabolites’, where available. Similarly, polyphenol boxes contain the additional link ‘show pharmacokinetics’ in addition to ‘show content in foods’. There is also a new box type for matches corresponding to polyphenol metabolites. In the same way as for polyphenols, a chemical structure is shown, accompanied by the single link ‘show food sources and pharmacokinetics’. If a compound is both a food component and metabolite, it appears separately as both a ‘polyphenol’ and a ‘polyphenol metabolite’, distinguishing the routes taken to arrive at food composition or metabolism data. Therefore, after the retrieval of a food or compound or interest using the simple search, the user chooses whether to then pursue food composition or in vivo metabolism data.
Alternatively, data may be retrieved using links in the main toolbar, which appears at the top of every page. This toolbar allows the complete list of foods, food polyphenols or polyphenol metabolites to be browsed. The ‘Metabolism’ tab is new for Phenol-Explorer 2.0, and the user is able to browse the whole list of metabolites (Figure 3). This list may be filtered by polyphenol class and subclass using a scrolling box at the top of the screen. For each metabolite, the molecular weight, species in which identified, biofluid and the number of references in which detected are shown. New text boxes at the top of each column allow the further filtering of data according to these criteria. A clickable button links to a list of all sources (foods, food extracts or pure compounds) that have led to the detection of a given metabolite in either urine or plasma.
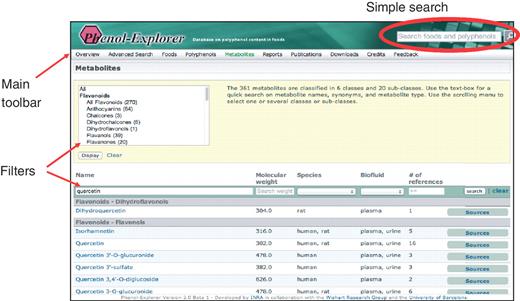
Phenol-Explorer 2.0 page layout and search methods.
Upon retrieval of a food, a link leads directly to a list of all metabolites identified after consumption of that food, which is displayed in the form of a data table (Figure 4). Metabolite identified in biofluids, composition of the source, range of doses administered, number of recipients of the dose, total number of subjects, urinary and plasma pharmacokinetic data and reference information are displayed. Urinary pharmacokinetic data consist of two columns, one for mean urinary excretion and another for a graph icon, if a time course of excretion is available. Plasma pharmacokinetic data are further divided into five columns, one for each of Tmax, Cmax, T1/2, AUC and another for a graph icon, if a plasma concentration time course is available. Metabolites are grouped according to whether they were detected before or after enzymatic deconjugation and by human or animal studies.
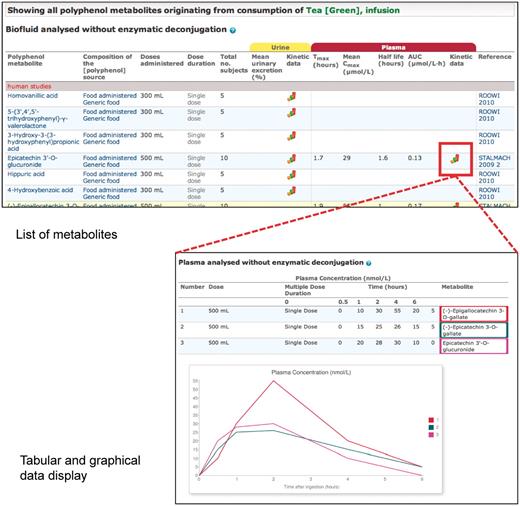
Tabular and graphical data output from Phenol-Explorer 2.0.
Phenol-Explorer 2.0 is, to the best of our knowledge, the first searchable database to contain urinary excretion and plasma concentration time courses for any metabolites formed in humans or experimental animals. These graphs are displayed by clicking on the graph icon corresponding to a particular polyphenol source or metabolite (Figure 4). References are displayed at the top of the page followed by the graph(s) and corresponding data in tabular format. If more than one quantity of the same dose was administered, the corresponding curves are overlaid. In addition, there is a tick box (‘show related metabolites from the same publication’) allowing the user to overlay comparable data from the same study, such as different metabolites after administration of the same polyphenol source or the same metabolite after administration of experimental and control foods.
Discussion
Metabolism studies were variable in their design, and certain rules for handling different doses and time scales, analytical methods and units had to be fixed for data entry. In many studies, a single dose was given, and biofluids were taken for analysis at one or more time points after this dose. In others, the same dose was repeated continuously over a certain time or incorporated as part of a standardized diet (in the case of animal studies). Output data resulting from repeated doses are clearly marked as such. The dose unit is then usually expressed in weight unit per day and the time period over which the dose was repeated clearly stated.
A limited number of conjugated polyphenol metabolites (53 glucuronides and 23 sulfate esters) have been fully identified in the literature, mainly due to the limited availability of commercial standards. Polyphenol metabolites have more often been identified as aglycones after hydrolysis by β-glucuronidase and sulfatase enzymes. Therefore, analytical data obtained with and without enzymatic deconjugation are reported separately.
Plasma and urinary pharmacokinetic data were expressed in publications in a wide range of units. The treatment of plasma data was more straightforward than that of urinary data, because the former are almost always point concentrations expressed in moles or weights per volume. Plasma concentrations expressed as weights per volume were converted to molar concentrations for easier comparison. Urinary data may also be point concentrations. Excretion values are sometimes normalized by creatinine excretion but are more commonly expressed as an amount excreted, in moles or grams, during a particular time period. They may also be expressed as a percentage of the polyphenol dose in intervention studies with pure polyphenols or when the nature of the ingested polyphenol can be identified without any ambiguity. Urinary data could not be standardized to a common unit, as creatinine concentration and urine volume are most often missing from the publication. The original unit was therefore retained. To graphically represent amounts of metabolite excreted over given time periods (such as 0–2 h and 2–5 h), amounts of metabolite excreted were summed to produce cumulative urinary excretion curves.
The database allows various fundamental questions on food polyphenol metabolites to be answered. The main aim of Phenol-Explorer 1.0 was to easily retrieve the polyphenol content of a food of interest. Phenol-Explorer 2.0 now allows to retrieve all reliably identified plasma and urinary metabolites formed from a given food, food extract or pure polyphenol. Therefore, while the user could previously obtain an instant estimate of the polyphenol intake from an intervention study dose, Phenol-Explorer 2.0 enables the display of all metabolites identified in plasma and urine, along with plasma concentrations, pharmacokinetics and a minimum extent of absorption as estimated by urinary recovery. Similarly, if the researcher was interested in a particular polyphenol, they could instantly find out from Phenol-Explorer 1.0 which foods provide that polyphenol. With the second release, researchers interested in a particular polyphenol metabolite (whose bioactivity may have been postulated from in vitro studies) may instantly recall a list of foods known to give rise to that metabolite. This information is key in the identification of putative biomarkers of exposure specific to different dietary polyphenols and can be used to better characterize exposure in population studies (16).
In addition, every effort has been made to retain comparisons between polyphenols and sources made in a given intervention study; if the plasma time course of a metabolite of interest is recalled, a link then allows the graphical comparison of different metabolites examined in the same study. Phenol-Explorer 2.0, as well as providing answers to general questions on polyphenol metabolism, incorporates the comparisons made within individual metabolism studies.
Phytochemical databases were recently reviewed (17), and Phenol-Explorer 2.0 is the first to include chemical information on this important class of phytochemicals as well as comprehensive information on food composition, metabolism and pharmacokinetics. Databases containing metabolism and pharmacokinetics data for certain drugs are already available (18, 19), although Phenol-Explorer is the first to contain similar data for natural or dietary compounds and to allow all retrieved information to be traced back to the original publications. It is also unique in that all intervention studies have been systematically analyzed and relevant data comprehensively curated. The database will be periodically updated to ensure that the current state of polyphenol metabolism research is adequately represented.
Conclusions
Phenol-Explorer was initially conceived to allow the retrieval of screened and aggregated compositions of polyphenols in foods, enabling definitive data to be obtained in a matter of seconds and saving the user the time and effort of manual literature searches. Similar objectives were intended for Phenol-Explorer 2.0 and its metabolism data. We believe that this update has transformed Phenol-Explorer to a more comprehensive polyphenol knowledge base, especially when food composition data are used in tandem with metabolism data. Phenol-Explorer 2.0 should greatly aid the advance of the understanding of the relations between polyphenol consumption and health by helping researchers design and interpret studies on these important dietary components.
Funding
Danone Research; the Institut National du Cancer (INCa 2011-105) and Spanish national grants (CICYT-AGL2009-13906-C02-01/ALI, CSD2007-063) from the CONSOLIDER INGENIO 2010 Program, FUNC-FOOD project, Spanish Ministry of Science and Innovation, MICINN. CIBER Fisiopatología de la Obesidad y Nutrición (CIBEROBN) is an initiative of ISCIII. Sara Borrell postdoctoral grant (CD09/00134 to M.U.-S.) and predoctoral FPU grant (to M.B.-O.), both from the MICINN. Ramon y Cajal program from the MICINN and the Fondo Social Europeo (FSE) (to R.L.). Funding for open access charge: Department of Computing Science, University of Alberta.
Conflict of interest: none declared.
References
Author notes
Present address: Augustin Scalbert, International Agency for Research on Cancer (IARC), Lyon, France.
