


Abstract
In many databases, biocuration primarily involves literature curation, which usually involves retrieving relevant articles, extracting information that will translate into annotations and identifying new incoming literature. As the volume of biological literature increases, the use of text mining to assist in biocuration becomes increasingly relevant. A number of groups have developed tools for text mining from a computer science/linguistics perspective, and there are many initiatives to curate some aspect of biology from the literature. Some biocuration efforts already make use of a text mining tool, but there have not been many broad-based systematic efforts to study which aspects of a text mining tool contribute to its usefulness for a curation task. Here, we report on an effort to bring together text mining tool developers and database biocurators to test the utility and usability of tools. Six text mining systems presenting diverse biocuration tasks participated in a formal evaluation, and appropriate biocurators were recruited for testing. The performance results from this evaluation indicate that some of the systems were able to improve efficiency of curation by speeding up the curation task significantly (∼1.7- to 2.5-fold) over manual curation. In addition, some of the systems were able to improve annotation accuracy when compared with the performance on the manually curated set. In terms of inter-annotator agreement, the factors that contributed to significant differences for some of the systems included the expertise of the biocurator on the given curation task, the inherent difficulty of the curation and attention to annotation guidelines. After the task, annotators were asked to complete a survey to help identify strengths and weaknesses of the various systems. The analysis of this survey highlights how important task completion is to the biocurators’ overall experience of a system, regardless of the system’s high score on design, learnability and usability. In addition, strategies to refine the annotation guidelines and systems documentation, to adapt the tools to the needs and query types the end user might have and to evaluate performance in terms of efficiency, user interface, result export and traditional evaluation metrics have been analyzed during this task. This analysis will help to plan for a more intense study in BioCreative IV.
Introduction
Biological databases are an integral part of the tool set that researchers use on a daily basis for their work as they serve to collect and provide access to our expanding knowledge of biology. They enable a more systematic access to information that otherwise would be buried in unstructured text, facilitating programmatic analysis of biological datasets. Database biocuration is a key activity to provide high-quality information. It could be defined as the analysis, interpretation and integration of biological information, primarily to add value by annotating and interconnecting research data and results within a common biological framework (1). To achieve this, expert biocurators may need to read and extract relevant information from the biomedical literature. This literature curation presents a considerable bottleneck in the biocuration process both in terms of speed (efficiency) and cost (biocurator’s time); however, text mining tools have the potential to speed up the curation process if they perform useful tasks with sufficient accuracy and speed (2). Hirschman et al. (2) conducted a survey, among a group of 30 biocurators representing 23 databases, which identified some biocurator priorities and showed that two-thirds of the biocuration teams had experimented with text mining and almost half were using text mining in some aspect of curation. Biocurators required tools that were simple to use, easy to install and straightforward to maintain by the intended end user. Rather than providing high-performance tools in terms of formal evaluation scores, biocurators were more concerned with practical aspects that can assist the biocuration process. Some of these aspects included the request of producing ranked results and confidence scores, linking of automatically extracted annotations to evidence passages in the text, providing visualization aids (such as highlighting different levels of annotations) and allowing flexible export of results in standard formats (2). With these needs in mind, BioCreative (Critical Assessment of Information Extraction in Biology, http://www.biocreative.org/) (3–6), whose aim is to promote the development of text mining and text processing tools that are useful to the communities of researchers and biocurators, introduced an interactive task (IAT) in BioCreative III (7). A critical aspect of BioCreative III was the active involvement of a representative group of end users to guide development and evaluation of useful tools and standards. The IAT, although demonstrative, fostered the interaction of developers and biocurators and inspired the development/improvement of interfaces that can be used in a biocuration workflow (8). The positive reception of this task by both the text mining and the biocuration communities prompted the organization of the BioCreative 2012 workshop, centered on interactive text mining in the biocuration workflow. In particular, the work presented in this article was an interactive text mining and user evaluation task. Like the BioCreative III IAT (7), it was non-competitive, and the goals were to engage users, provide the means to experiment with different approaches to formally assess interactive systems as well as to collect specifications and metrics that will set the stage for the BioCreative IV challenge to be held in October 2013. Hosting the workshop as a satellite to the International Biocuration meeting provided a unique opportunity to engage biocurators in this activity.
Lessons learned from BioCreative III IAT
In the BioCreative III IAT, the goal was to develop an interactive system to facilitate manual annotation of unique database identifiers for all genes appearing in an article. This task included ranking genes by importance (based preferably on the amount of described experimental information regarding genes) (7). There was also an optional task to assist the user in retrieving the most relevant articles for a given gene. To aid in carefully designing this task, a user advisory group (UAG; http://www.biocreative.org/about/biocreative-iii/UAG/) was assembled that played an active role in assessing IAT systems and in providing a detailed guidance for a future, more rigorous evaluation of IAT systems (7).
Some important lessons learned from this activity include the following: (i) early team-up of developers with biocurators is important to work together throughout the process of system development; (ii) sufficient time is needed for system training; (iii) selection of a corpus that is relevant to the users domain of expertise (such as species-specific documents for model organism databases and pathway-centric documents for pathway databases) and (iv) encouragement of text mining developer participation in biocuration meetings to facilitate interaction with biocurators. As observed in the biocurators survey, a users’ adoption of automated tools into their curation process will depend heavily on performance and on the overall convenience of a tool.
Built upon these observations, we designed the BioCreative 2012 workshop interactive track described here.
Materials and methods
This section provides an outline of the BioCreative 2012 IAT planning, starting with modifications from the previous BioCreative IAT, the recruitment of participants and coordinators, preparation of datasets and the evaluation. Figure 1 summarizes the workflow of the BioCreative 2012 IAT activity, divided into three main phases: preparation, training and evaluation and indicating the tasks performed by teams, biocurators and coordinators, along with some important dates. Some of the details are described as follows.
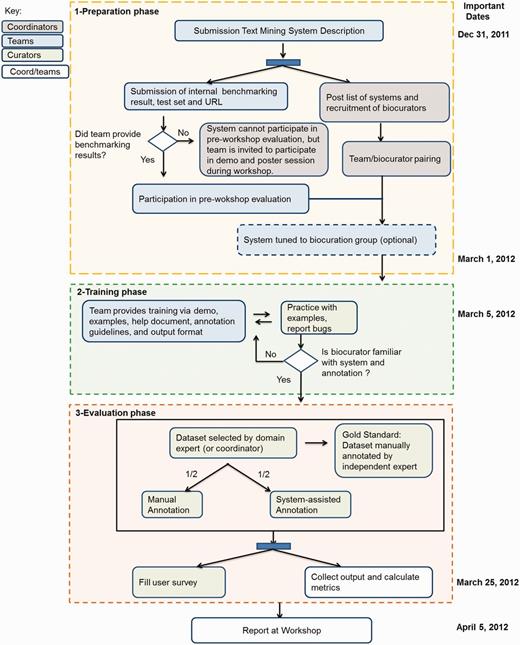
BioCreative 2012 workshop workflow. The chart shows the three main phases for this activity: (1) the preparation phase included the system and document preparation by teams, recruitment of biocurators to test each system and modification of the system for the assigned biocuration group; (2) the training phase actively involved both teams and biocurators, the former to provide the necessary support to use the system, the latter to learn about the curation task and the system functionalities, reporting system’s bugs when necessary and (3) the evaluation phase included the selection of corpus and manual annotation by expert (to create gold standard), annotation of this corpus by biocurators, half manually and half system-assisted, along with time recording and filling of the user survey. The results were collected by teams and coordinators and presented at the workshop. Some important dates are indicated on the right side.
IAT in BioCreative 2012 workshop
Based on the considerations brought up by the UAG in BioCreative III, we introduced some modifications to the IAT in the BioCreative 2012 workshop, such as
Teams presented documentation for their systems, curation guidelines when needed, a practice set for biocurators and benchmarking of the system previous to the evaluation. This was to ensure the tools’ performance and scope would be adequate for the proposed biocuration task.
The systems could include any biocuration task as opposed to BioCreative III, which was limited to gene normalization/ranking. Biocurators with experience in the relevant biocuration tasks were recruited and paired with developers early in the process. This interaction allowed systems to be tuned to the user’s curation interests to make results more relevant to them.
The period for a biocurator’s training on and evaluation of a system was significantly extended (from 10 to 20 days) in comparison with BioCreative III.
The BioCreative 2012 workshop was hosted as a satellite to the International Biocuration meeting to encourage participation of text mining developers in the biocuration meeting as well as participation of biocurators in the BioCreative workshop.
Recruitment of participants
Text mining teams
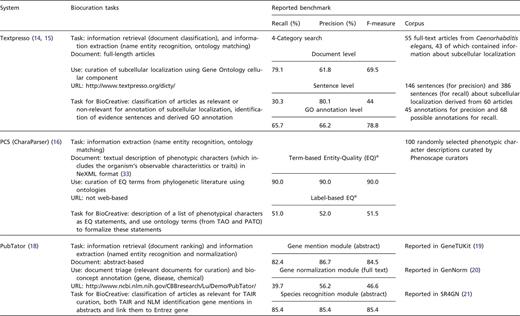
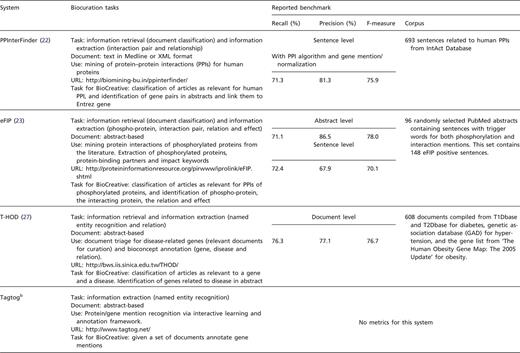
We openly invited text mining teams to participate in the IAT by presenting systems that focused on any given biocuration task. Registered teams were requested to submit a document describing their system and addressing questions related to relevance and impact of the system, adaptability, interactivity and performance. In addition, teams were asked to indicate the limitations of the system, provide details on the biocuration task and suggest evaluation metrics. Each system was assigned a coordinator to supervise and assist in the activity (see ‘Coordinators’ section). The list of systems with brief description (Table 1) and the accompanying documentation were posted on the BioCreative website (http://www.biocreative.org/tasks/bc-workshop-2012/track-iii-systems/) for biocurators to select and sign up for testing.
Systems registered in BioCreative 2012 Track III
 |
 |
|
|
System descriptions with task proposed in BioCreative and reported internal benchmark results. aTerm-label EQs are EQ statements created strictly based on the original descriptions, independent of any ontologies, whereas the label-based EQs are the corresponding formal statements (using ontology terms). bThis system only participated at the workshop.
Systems registered in BioCreative 2012 Track III
|
|
|
|
System descriptions with task proposed in BioCreative and reported internal benchmark results. aTerm-label EQs are EQ statements created strictly based on the original descriptions, independent of any ontologies, whereas the label-based EQs are the corresponding formal statements (using ontology terms). bThis system only participated at the workshop.
Biocurators
We invited biocurators to participate in the BioCreative IAT by distributing the call for participation via the International Society for Biocuration (ISB) mailing list, and the ISB meeting and BioCreative websites. Biocurators had the option to participate at different levels, namely, by assisting in selecting and annotating datasets to create the gold standards, by participating in the pre-workshop evaluation of a system of their choice based on the list provided in Table 1, and/or by participating in the workshop. Around 40 biocurators participated in this activity, Table 2 shows the wide variety of databases/institutions they represented and the different participation level (dataset annotations and system evaluations).
Participating databases/institutions in BioCreative Workshop 2012
| Database/Institution type | Database/Institution | Gold standard annotation | Pre-workshop Evaluation | Workshop evaluation |
|---|---|---|---|---|
| Industry | AstraZeneca (1) | ✓ | ||
| Merck Serono (1) | ✓ | ✓ | ||
| Pfizer (1) | ✓ | ✓ | ||
| Literature | NLM (1) | ✓ | ✓ | |
| Model Organism (MOD)/Gene Ontology Consortium (GOC) | AgBase (1) | ✓ | ||
| dictyBase (2) | ✓ | ✓ | ✓ | |
| FlyBase (1) | ✓ | |||
| MaizeDB (1) | ✓ | |||
| MGI (3) | ✓ | ✓ | ||
| SGD (1) | ✓ | ✓ | ||
| TAIR (2) | ✓ | ✓ | ✓ | |
| WormBase (1) | ✓ | |||
| XenBase (1) | ✓ | |||
| ZFIN (1) | ✓ | |||
| Ontology | Plant ontology (1) | ✓ | ✓ | |
| Protein ontology (2) | ✓ | |||
| Pathway | Reactome (2) | ✓ | ||
| Phenotype | GAD (1) | ✓ | ||
| Phenoscape (3) | ✓ | ✓ | ✓ | |
| Protein–protein interaction | BioGrid (1) | ✓ | ✓ | |
| MINT (1) | ✓ | ✓ | ||
| Others (approx. 11) | ✓ |
Numbers in parentheses are the number of biocurators from each institution. Biocurators aided in dataset annotations and system evaluations
Coordinators
Coordinators were members of the BioCreative 2012 workshop steering committee who assisted in supervising and facilitating the communication between biocurators and developers. Some of the roles of the coordinators included the following: (i) matching and introducing biocurators to systems, (ii) supervising the creation of the corpus to serve as a gold standard for use in the evaluation, (iii) overviewing the activity, (iv) ensuring participation of the teams at the workshop (registration), (v) guiding biocurators on the steps needed to complete evaluation and (vi) collecting metrics.
Datasets
The selection of suitable data collections for the evaluation was inspired by real curation tasks as well as keeping in mind the biocuration workflows. Each system had its own dataset that was selected by its coordinators and the domain experts that were involved in the annotation of the gold standard. In most cases, the dataset consisted of a collection of 50 PubMed abstracts randomly selected from a pool of possible relevant articles. A summary of the dataset selection and information captured is presented in Table 3. Note that the format of an annotated corpus varied depending on the system’s output. This table also shows groups involved in the annotation of such corpora, and those who in the end evaluated the systems.
Dataset preparation for systems in BioCreative Workshop 2012
| System | Dataset selection for pre-workshop evaluation | Information captured | Biocurators involved in gold standard annotation | Biocurators involved in annotation in evaluation |
|---|---|---|---|---|
| Textpresso | 30 full-length articles about Dictyostelium discoideum from 2011 to 2012 not yet annotated in dictyBase. This set contains 61 GO cellular component annotations in 124 sentences as annotated by senior dictyBase biocurator | Paper Identifier, annotation entity, paper section, curatable sentence, component term in sentence, GO term, GO ID and evidence code. | dictyBase senior curator | dictyBase and Plant Ontologya |
| PCS | 50 textual descriptions of phenotypic characters in NeXML format randomly selected from 50 articles about fish or other vertebrates. Gold standard 50 character descriptions annotated by a senior Phenoscape biocurator | Entity term, entity ID, quality term, quality ID, quality negated, quality modifier, entity locator, count and more | Phenoscape senior curator | ZFIN and Phenoscape |
| PubTator | TAIR set: 50 abstracts (24 relevant) sampled from November 2011 for Arabidopsis already curated by TAIR | Gene indexing: gene names and Entrez gene ID | Existing annotated corpus | TAIR and National Library of Medicine (NLM) |
| NLM set: 50 abstracts sampled from Gene Indexing Assistant Test Collection (human) | Document triage information: list of relevant PMIDs | |||
| PPInterFinder | 50 abstracts describing human kinases obtained by using a combination of tool/resources (such as UniProt, PubMeMiner, FABLE, and PIE). | PMID, protein interactant name 1, protein interactant name 2 | NR | BioGrid and MINT |
| eFIP | PMID-centric: 50 abstracts randomly selected based on proteins involved in two pathways of interest to Reactome autophagy and HIV infection | PMID, phosphorylated protein, phosphorylated site, interactant name, effect, evidence sentence | NR | Merck Serono, Reactome, and SGDb |
| gene-centric: 10 first-ranked abstracts for 4 proteins involved in the adaptive immune system (Reactome: REACT_75774) | ||||
| T-HOD | PMID-centric: 50 abstracts from 2011 journals about obesity, diabetes or hypertension | PMID, EntrezGene ID, gene name, disease, gene–disease relation, evidence sentence | Protein Ontology senior curator | Pfizer, Reactome, GAD, and MGI |
| gene-centric: review relevancy of documents for four genes |
NR:non-recorded. aCurator novice to GO annotation. bSGD curator participated in first evaluation which is not reported in performance results here.
Evaluation
We planned two evaluations, a pre-workshop formal evaluation of the systems based on the selected corpus that included both systems’ performance and subjective measures (explained later) and an informal evaluation consisting of the systems’ testing at the workshop during the demonstration (demo) session. The latter included only the subjective measure representing mostly the user’s first impression of a system.
Performance and usability of systems were calculated based on the following metrics:
As ‘performance measures’ we included comparison of time on task for system-assisted versus manual curation; and a precision/recall/F-measure of the automatic system versus the gold standard annotations (dataset independently manually curated by domain expert) and/or manual versus system-assisted annotations again rated by the gold standard.

For the ‘subjective measure’ we prepared a survey meant to record the subjective experience of the user with the system. The survey consisted of five main categories, namely, overall reaction, system’s ability to help complete tasks, design of application, learning to use the application and usability, in addition to ‘recommendation of the system’ that was evaluated separately; these categories were based on those developed for the Questionnaire for User Interface Satisfaction (QUIS) developed by Chin et al. and shown to be a reliable guide to understanding user reactions (9). Each category contained questions to be rated based on a seven-point Likert scale (10). The nature and form of the questions was inspired in part by those developed for QUIS and in part by other work: the computer system usability questionnaire (11), the perceived usefulness and ease of use survey (12) and the USE questionnaire (13). Questions used by these surveys were modified by the authors to better address specific aspects of interfaces for biocuration. The survey remains available at http://ir.cis.udel.edu/biocreative/survey.html.
During the pre-workshop evaluation, biocurators curated half of the dataset manually following the format provided by each system and half using the assigned system, recording the corresponding time on task.
Results
This section describes the results of the BioCreative 2012 worskhop IAT, and it is organized as follows: we first describe the pre-workshop evaluation, including details on each participating system, followed by a summary of the results. Then we describe the activity at the workshop, and finally, we provide a general summary of the evaluation including results from the demo session.
Participating systems
Six of the seven teams registered and provided the required system description, benchmarking results and were ready for testing by the agreed deadline (Table 1). The biocuration tasks proposed by the registered systems were widely heterogeneous, including extracting gene–disease relationships or protein–protein interactions, finding the genes mentioned in an abstract and correlating the mentioned genes to systematic nomenclature, ontology matching and retrieving documents mentioning specific diseases or chemicals. The reported metrics (Table 1) provided evidence that the system performance was reasonable and the systems were in good condition for testing. An additional system participated only in the demo session during the workshop.
Pre-workshop evaluation
The task by the curators included training, annotation and filling of the user survey (Figure 1). For the training, each biocurator needed to perform a series of tasks that included getting familiar with the system and curation guidelines provided by developers. At this stage, frequent communication between biocurators and developers was encouraged, and various modalities were exploited. Some of the groups had teleconferences with biocurators or demonstrated their system in a webinar-like format, whereas others provided all documentation via e-mails or via the coordinator. During this time, users could also report system bugs that could be addressed before testing. The annotation (evaluation per se) involved in all cases manual curation of a set of documents and curation of another set using the selected system. The manual output was according to a format provided by the systems.
A summary of the setting and results for the individual systems is presented in this section. Tables 4–6 summarize the performance and subjective measures.
System performance metrics in pre-workshop evaluation
| System performance measure (%) | System output versus gold standard annotation | System-assisted annotations | Manual annotation | |||||
|---|---|---|---|---|---|---|---|---|
| Textpresso | ||||||||
| Sentence level | ||||||||
| Category 4a | System alone | |||||||
| Recall | 37.9 | |||||||
| Precision | 77.5 | Curator 1b | Curator 2b | |||||
| F-measure | 50.9 | 55.1 | 26.9 | |||||
| Category 5a | System alone | 41.7 | 63.3 | |||||
| Recall | 39.7 | 47.5 | 37.8 | |||||
| Precision | 81.5 | |||||||
| F-measure | 53.4 | |||||||
| GO annotation level | ||||||||
| Category 4a | Curator 1 | Curator 2 | ||||||
| Recall | 37.1 | 14.5 | Curator 1b | Curator 2b | ||||
| Precision | 78.3 | 77.8 | 86.8 | 39.5 | ||||
| F-measure | 50.3 | 24.4 | 42.8 | 41.2 | ||||
| Category 5a | Curator 1 | Curator 2 | 57.3 | 40.3 | ||||
| Recall | 32.2 | 11.3 | ||||||
| Precision | 75.0 | 71.4 | ||||||
| F-measure | 45.1 | 19.5 | ||||||
| PCS | ||||||||
| Term-based EQsc | System alone | Curator 1 | Curator 2d | Curator 3 | ||||
| Recall | 65.0 | 47.0 | 38.0 | 50.0 | ||||
| Precision | 60.0 | 57.0 | 65.0 | 67.0 | ||||
| F-measure | 62.4 | 51.5 | 48.0 | 57.3 | ||||
| Label-based EQsc | System alone | Curator 1 | curator 2d | Curator 3 | ||||
| Recall | 24.0 | 44.0 | 51.0 | 51.0 | ||||
| Precision | 23.0 | 54.0 | 81.0 | 74.0 | ||||
| F-measure | 23.5 | 48.5 | 62.6 | 60.4 | ||||
| Phenex + Charaparser | Phenex | |||||||
| Label-based EQsc | Curator 1 | Curator 2d | Curator 3 | Curator 1 | Curator 2d | Curator 3 | ||
| Recall | 51.0 | 38.0 | 66.0 | 37.0 | 63.0 | 36.0 | ||
| Precision | 58.0 | 70.0 | 84.0 | 49.0 | 88.0 | 60.0 | ||
| F-measure | 54.3 | 49.3 | 73.9 | 42.2 | 73.4 | 45.0 | ||
| PubTator | ||||||||
| NLM indexing mention-level | System alone | Curator 1 | Curator 1 | |||||
| Recall | 80.1 | 98.6 | 91.0 | |||||
| Precision | 83.4 | 98.3 | 93.0 | |||||
| F-measure | 81.7 | 98.0 | 92.0 | |||||
| TAIR indexing document level | System alone | Curator 2 | Curator 2 | |||||
| Recall | 76.0 | 90.0 | 91.0 | |||||
| Precision | 73.9 | 77.1 | 75.0 | |||||
| F-measure | 74.9 | 83.0 | 82.0 | |||||
| TAIR triage | System alone | Curator 2 | ||||||
| Recall | 68.6 | 84.6 | ||||||
| Precision | 80.5 | 100.0 | ||||||
| F-measure | 74.1 | 92.0 | ||||||
| PPInterFinder | ||||||||
| PPI algorithm alone | System alone | Curator 1 | Curator 2 | Curator 1 | Curator 2 | |||
| Recall | NR | 69.8 | 63.8 | 72.7 | 79.7 | |||
| Precision | 85.7 | 85.7 | 87.0 | 90.4 | ||||
| F-measure | 76.9 | 73.2 | 79.2 | 84.7 | ||||
| PPI algorithm (gene mention/ gene normalization) | System alone | Curator 1 | Curator 2 | |||||
| Recall | NR | 46.9 | 46.9 | |||||
| Precision | 85.7 | 85.7 | ||||||
| F-measure | 60.6 | 60.6 | ||||||
| eFIP | ||||||||
| PMID-centric (sentence level) | System alone | Curator 1 | Curator 2 | Curator 1 | Curator 2 | |||
| Recall | NR | 69.2 | 88.2 | 89.5 | 77.8 | |||
| Precision | 94.7 | 79.0 | 85.0 | 70.0 | ||||
| F-measure | 80.0 | 83.3 | 87.2 | 73.7 | ||||
| Gene-centric (document level) | System alone | Curator 1 | Curator 2 | Curator 1 | Curator 2 | |||
| Recall | NR | 78.6 | 85.7 | 100.0 | 77.8 | |||
| Precision | 91.7 | 85.7 | 83.3 | 77.8 | ||||
| F-measure | 84.6 | 85.7 | 90.9 | 77.8 | ||||
| Document-ranking | ||||||||
| nDCG | 93–100 | |||||||
| T-HOD | ||||||||
| PMID-centric (sentence level) | System alone | Curator 1 | Curator 2 | Curator 3 | Curator 4 | |||
| Recall | 70.0 | 56.0 | 22.0 | 24.0 | 42.0 | |||
| Precision | 79.5 | 32.0 | 26.0 | 40.0 | 42.0 | |||
| F-measure | 74.5 | 40.0 | 24.0 | 30.0 | 42.0 | |||
| Gene-centric (document level) | System alone | Curator 1 | Curator 2 | Curator 3 | Curator 4 | |||
| Recall | 54.3 | 56.0 | 30.0 | 26.0 | 42.0 | |||
| Precision | 72.1 | 63.0 | 41.0 | 52.0 | 71.0 | |||
| F-measure | 62.0 | 59.0 | 35.0 | 35.0 | 53.0 | |||
a4-Category search use ‘bag of words’ for (1) assay terms, (2) verbs, (3) cellular component terms, and (4) gene product names, whereas 5-Category search also include words for Table and Figures. bManual annotations don't necessarily correspond to either the 4- or 5-category search as curators do annotations for sentences that fit both criteria. cTerm-label EQs are entity-quality statements created strictly based on the original descriptions, independent of any ontologies, whereas the label-based EQs are the corresponding formal statements (using ontology terms). dCurator ignore an unspecified number of CharaParser proposals to save time.
Ratio of time for task completion: manual/system-assisted and curation time range
| Time ratio manual/system | Time range (min) | |||||
|---|---|---|---|---|---|---|
| System | Curator 1 | Curator 2 | Curator 3 | Curator 4 | Manual | System |
| Textpresso | 2.3 | 2.5a | 375–692 | 150–297 | ||
| PCS | 1.0 | 0.8 | 135–210 | 165–210 | ||
| Pubtator | 1.8 | 1.7 | 83–135 | 49–79 | ||
| PPInterFinder | 0.9 | NR | 58 | 62 | ||
| eFIP | 2.4 | 2.5 | 88–120 | 35–50 | ||
| T-HOD | 0.9 | 1.3 | 1.2 | 4.0 | 110–140b | 110–120b |
NR, not recorded. aOnly after getting familiar with the tool. bOne curator was significantly faster 60 min manual to 15 min with T-HOD and is not shown.
Overall rating for each system by category in pre-workshop evaluation
| Subjective measure (overall median for each section) | ||||||
|---|---|---|---|---|---|---|
| System | Overall evaluation | Task completion | System design | Learnability | Usability | Recommendation |
| Textpresso | 4.0 | 4.5 | 6.0 | 6.0 | 6.0 | 3.5 |
| PCS | 3.0 | 3.0 | 4.5 | 6.0 | 7.0 | 3.0 |
| PubTator | 6.0 | 6.0 | 6.0 | 6.0 | 6.0 | 7.0 |
| PPInterFinder | 2.5 | 1.0 | 4.5 | 5.5 | 3.5 | 2.0 |
| eFIP | 5.5 | 6.0 | 6.0 | 6.0 | 6.0 | 5.0 |
| THOD | 4.0 | 3.0 | 4.5 | 5.0 | 5.0 | 3.0 |
Median value for questions linked for each of the categories. Likert scale from 1 to 7, from worst to best, respectively.
Textpresso (14)
This system is designed to retrieve sentences describing subcellular localization of gene products from the full text of papers. To identify these sentences, papers are searched using Textpresso categories, which are ‘bags of words’ that encompass terms of a common semantic concept. The categories used for the subcellular localization search are as follows: 1-assay terms, 2-verbs, 3-cellular component terms, 4-gene product names, plus an additional category and 5 tables and figures. Matching sentences must contain at least one term from each of these categories (15). In BioCreative, Textpresso was applied for the curation of cellular localization in selected documents for Dictyostelium discoideum using the GO cellular component ontology. For evaluating the results of the Textpresso searches, biocurators examined sentences from two different searches, namely, Category 4, including Categories 1–4, and Category 5, which adds the fifth category. Textpresso results were evaluated at the level of sentences as well as GO annotations that could be made from those sentences. At the sentence level, precision is defined as percentage of sentences retrieved by Textpresso that were relevant (i.e. described subcellular localization) and recall as percentage of relevant sentences Textpresso retrieved from the test documents. At the GO annotation level, precision is defined as the percentage of GO annotations made from Textpresso sentences that match either the gold standard GO term or a parent term (i.e. a correct but less granular term) in the ontology. The performance of Textpresso on the evaluation dataset at the sentence level is comparable to that presented in the internal benchmarking for Category 4 (precision and recall 80.1% and 30.0%, respectively, compare sentence level in Benchmark Tables 1 and 4). Also, the performance is similar for both category searches (compare results for system alone in Table 4). Textpresso-based GO annotation results show that it provides high-precision annotations when compared with manual annotation (compare GO annotation level in system-assisted annotation and manual annotation in Table 4). In terms of curation efficiency, Textpresso increased curation efficiency, once biocurators were familiarized with the system, by decreasing curation time ∼2.5-fold (Table 5). In all cases, recall is lower than precision, which is related to (i) technical issues of the system, (ii) missing category terms and (iii) a statement in a paper correctly describes localization but is missing a category term (i.e. the result is described using less than the four or five required Textpresso categories). The survey results for the two biocurators involved were heterogeneous. It is relevant to mention that one of the curators was a novice to GO annotation, and results of the survey by this curator could reflect the experience with both system and curation task (Table 6).
Phenoscape Curation System (16)
This system is designed for the curation of phenotypes from evolutionary literature on fishes and other vertebrates. Three biocurators did the evaluation using Phenex (17) (curation system used by Phenoscape biocurators), and using the Phenoscape curation system (PCS) system (consisting of Phenex plus CharaParser, the text mining tool). The curation task required curators to capture the phenotypical characters in the form of entity and quality terms (EQ) and identifiers (IDs) from a number of anatomic and phenotypic quality ontologies. Recall and precision on term-based EQs (i.e. EQs created strictly based on the original descriptions, independent of any ontologies) and label-based EQs (i.e. the result of translating and transforming the terms in term-based EQs to their best-matched class labels in related ontologies) were calculated. The performance is significantly lower than the one reported in the benchmarking (compare results from system alone in Table 4 with those of Table 1). However, term-based performance of PCS has higher recall than biocurators’ performance and similar precision, whereas label-based performance of PCS was about half of biocurators’ performance (compare system alone versus manual curation in Table 4). Interestingly, inter-annotator agreement was low (precision among pair of annotators ranged from 31% to 77%, and recall 49% to 71%), which highlights the difficulty of phenotype curation. The comparison of performance on label-based EQs generated by biocurators using Phenex and PCS shows that the text mining tool improved curation accuracy for two of the three biocurators (compare Phenex and Phenex+Charaparser results in Table 4). Curation efficiency in terms of time on task was not improved by using the tool (Table 5). In this evaluation, PCS’s failures relate to (i) the inherent difficulty of the phenotype curation task involved in translating term-based EQs to label-based EQs as there is no well-defined way to perform some of the translations; (ii) the incompleteness of ontology coverage (since 55% of the target EQ classes were not included in the ontologies, the maximum possible performance of CharaParser would be 45% precision/recall); and (iii) the failure in equipping CharaParser with all ontologies used by biocurators. The results from the three biocurator surveys were heterogeneous. A consistently low rating (≤3) was given to all questions related to the system’s ability to help complete tasks, whereas consistently high ratings (≥4) were given to the usability of the tool (Table 6). Feedback from biocurators indicated that the tool needs better recognition of entities and qualities from the free text to improve the recall of the system (currently ‘to decrease the low recall of the system’)
PubTator (18)
PubTator is a web-based tool that allows biocurators to create, save and export annotations, with similar look and feel as PubMed. PubTator relies on three state-of-the-art modules: GeneTUKit for gene mention (19), GenNorm for normalization (20) and SRG4N (21) for species recognition. This system was set up for two specific biocuration tasks, namely, document triage (retrieve relevant papers to be curated) and bioconcept annotation. Biocurators from NLM and TAIR databases participated in the evaluation. The NLM biocurator worked at the mention level and normalized to NCBI Gene identifiers. The TAIR biocurator worked at the document level and normalized to TAIR’s own nomenclature. Besides gene indexing, the TAIR biocurators also conducted document triage task—abstracts were labeled as relevant for full curation or otherwise. As shown in Table 5, PubTator-assisted curation significantly improved efficiency (∼1.75-fold decrease in curation time) and also slightly increased accuracy compared with the baseline (compare manual curation with system-assisted in Table 4). According to the survey by the two biocurators involved, its users liked this system: median scores for each category are ≥6 and for all questions PubTator’s ratings were ≥4 (Table 6).
PPInterFinder (22)
This system was set up for extracting information about human protein–protein interactions. Biocurators from PPI databases evaluated this system, including biocurators from the MINT and BioGRID databases. The curation scenario was protein-centric, focusing on human kinases for which it is important to annotate protein interactions and phosphorylation events. PPInterFinder was evaluated at the sentence level where a true positive represents the number or proportion of interacting protein entities that were correctly identified by the system. The results show that there is a significant difference in the performance of this system when the processing stage of gene recognition is included in the IAT (compare PPI algorithm alone with PPI algorithm with gene mention in Table 4). It should also be noted that the performance differs (it is much lower) from the benchmark results reported in Table 1. The difference is due to protein names that could not be recognized or normalized, a problem already described in previous BioCreative efforts (BioCreative II and II.5 PPI task). The lower performance is also partly explained by the low inter-annotator agreement (36 agreements and 19 disagreements), which points that the annotation guidelines may not have been clear. In terms of curation efficiency, as recorded by time on task, there is information for only one biocurator and it shows the time for manual and system-assisted annotations were comparable (Table 5). According to the survey based on the two biocurators involved, this system was consistently rated very low in its ability to help complete tasks (Table 6). A few aspects of the design of the application were consistently rated on the high end. Biocurators indicated the need of more precise results and less false positives. Through the organization of this task, it was possible to exploit particular aspects of the biocurators feedback and evaluation in order to improve the PPInterFinder system. Aspects considered for this improvement include the reduction of the number of false-positive results by revising the dictionaries for relation keywords, by enhancing rules, patterns and the relation recognition algorithm.
eFIP (23)
A main goal of eFIP is to suggest documents containing information that is relevant for biocuration of phosphorylated proteins related to protein–protein interactions. The eFIP system ranks abstracts based on the amount of relevant information they contain and presents evidence sentences and a summary table with the phospho-protein, the interacting partner and impact words (increase, decrease, block, etc.). eFIP integrates text mining tools such as eGRAB (24) for document retrieval and name disambiguation, RLIMS-P (25) for extraction of phosphorylation information, a PPI module to detect PPIs involving phosphorylated proteins and an impact module to detect temporal and causal relations between phosphorylation and interaction events in a sentence. In BioCreative 2012, two tasks were planned as follows: (i) a PMID-centric task, given a set of documents identify curatable documents (those with phosphorylated proteins related to PPI), with the corresponding evidence sentences and (ii) a gene-centric triage task, given a gene, validate the relevancy of the documents retrieved by eFIP (Do articles retrieved contain phosphorylation and related PPI for the query protein?). Biocurators from Reactome, SGD and Merck Serono participated in the evaluation. eFIP performance was evaluated for document retrieval, sentence-level information extraction and document ranking. Besides the documents in the given dataset, users were asked to validate the ranking by eFIP output for relevant genes. Both at the sentence and document levels, eFIP achieved higher precision (compare system-assisted with manual curation in Table 4), but lower recall than manual curation (in many cases one biocurator ignored redundant annotations). The inter-annotator agreement was significant as indicated by a Cohen kappa coefficient (26) of 0.77 (54 agreements/7 disagreements) and eFIP improved curation efficiency by decreasing curation time ∼2.5-fold (Table 5). eFIP performance evaluation on document ranking as measured by nDCG (normalized discounted cumulative gain) based on the ranked lists of abstracts ranged between 93% and 100% (Table 4). In general, factors that contributed to a decrease of precision and recall in eFIP are mostly attributed to the PPI module: reporting interactions between entities other than proteins, failing to detect directionality on complex sentences and in a few cases inability to identify an interaction event. The survey by the three biocurators who participated in the evaluation indicates that users like the system (Table 6). It is relevant to mention that consistently high ratings (≥5) were given for all questions in the category system’s ability to complete the task. One of eFIP’s strengths seems to be the ease of finding relevant articles in the literature as manual dataset selection for this activity has been very challenging for organizers due to the complex relations captured by this tool.
T-HOD (27)
This system collects lists of genes that have proven to be relevant to three kinds of cardiovascular diseases—hypertension, obesity and diabetes, with the last disease specified as Type 1 or Type 2. It can be used to affirm the association of genes with these diseases and provides evidence for further studies. T-HOD relies on state-of-the-art text mining tools for gene identification (28) and for disease recognition, and disease–gene relation extraction (29). For BioCreative 2012, two tasks were planned as follows: (i) a PMID-centric task, given a set of documents identify sentences with gene–disease relations and (ii) a gene-centric task, given a gene, validate the relevancy of the output from T-HOD (Do articles retrieved contain gene–disease relation for the given gene?). Biocurators from Pfizer, Reactome, MGI and GAD participated in the evaluation. For the calculation of performance metrics in the PMID-centric approach, information regarding a gene–disease relation mentioned in an abstract including the gene term, gene ID and the sentence describing the relation all have to be exact with the gold standard in order to be a true positive. In the gene-centric approach, only the gene terms have to be correct to be considered as a true positive. The precision of T-HOD at the document level in the evaluation was similar to the one reported as benchmark results, but the recall was lower (compare Table 1 with system alone document level in Table 4). Interestingly, the performance of the system alone when compared with the gold standard was significantly higher than the biocurator’s set (compare system alone with system-assisted annotation in Table 4). The inter-annotator overall agreement was moderately low 57.47%, which may explain in part the performance results. The performance of the system in PMID-centric evaluation was lower than the gene-centric task mainly due to the fact that both the entity recognition (for gene and disease) and the relation extraction have to be correct in order to achieve good performance (Table 4). Of these tasks, the gene term recognition and normalization were the most difficult. In addition, there were some cross-sentence gene–disease relations in the gold standard, which is not yet supported by the system. In terms of curation efficiency, only one of the biocurators reported a significant increase 4-fold (Table 5). This biocurator only went through the positive examples suggested by the system and did not check for any false negatives. However, this biocurator seems much faster than others given that the manual curation also took a significantly shorter time than for the other biocurators (60 min versus 110–140 min for other three biocurators, Table 5). According to the survey of the four biocurators involved in the evaluation, the system’s ability to help complete tasks was the category with lowest median, whereas learning the application and usability were the ones with highest (Table 6). Some of the suggestions by the users included expanding to non-disease-centric queries, expanding scope to other diseases, improving some aspects of the interface (e.g. display window does not auto-adjust into the proper size of the browser; users are unable to return to reconsider their last action) and providing more documentation. T-HOD is working on an enhanced version based on these suggestions.
BioCreative 2012 workshop
At the workshop, which took place in Washington DC on April 4–5, 2012, each participating team presented the results of the pre-workshop evaluation. In addition, based on the success of the demo session in BioCreative III, we extended this session to include a usability evaluation by users. The teams demonstrated their system and biocurators attending the session had the opportunity to try systems. Each session was 30 min long. We collected opinions via the same user survey described in the ‘Materials and Methods’ section. We recruited new members for the UAG to assist in this endeavor. Each member was assigned two systems to ensure all systems were tested. Other biocurators present at the session could also test by selecting the system of their choice. At the end of the testing, the user had to fill the same user survey to the best possible extent and provide their first impression about the systems. We collected 22 survey responses in this activity. The results are included in the analysis shown in the next section. Although not reported in the metrics for this task, two additional groups demonstrated their systems: ToxiCat (30) and ODIN (8), both of which participated in the Triage challenge (Track I) of the workshop. Survey responses are available in Supplementary Table 1.
Overall analysis of the evaluation results
Note that we are aware of the limitations of this analysis both in terms of limited numbers of biocurators per system and the widely different nature of the tasks systems perform. For example, we cannot directly compare the performance metrics across systems. However, we can derive some useful observations and these are described next. The performance results from the pre-workshop evaluation indicate that a set of systems were able to improve efficiency of curation by speeding the curation task significantly (1.7- to 2.5-fold faster than performing it manually, Table 5). Acquiring familiarity with system output and curation tools were shown to be key for maximizing efficiency at least in one case (in Textpresso system one biocurator was novice to curation task, once familiarized the efficiency improved). Some of the systems were able to improve annotation accuracy when compared with manual performance (e.g. PubTator, eFIP and PCS, compare system-assisted with manual annotations in Table 4). In terms of inter-annotator agreement, the factors that contributed to significant differences for some of the systems were the expertise of the biocurator on the curation task (as happened in GO annotation), inherent difficulty of the curation task as was the case of the annotation of phenotypes and not following provided annotation guidelines (e.g. cases where an annotator is asked to mark all sentences but he/she chooses to pick a representative one). The results also show that many of the systems rely on the combination of many different text mining modules and how the performance of each one impacts significantly the performance of the entire system (addition of gene mention/normalization algorithm in PPInterFinder decreases performance of the system significantly, compare Table 4).
We hypothesize that questions that correlate highly to overall measures of satisfaction reflect greater importance to biocurators in general; if a system receives high scores for one question while scoring low on overall satisfaction, that question may not be particularly important to the biocurator’s experience. Based on the questionnaire in http://ir.cis.udel.edu/biocreative/survey.html, Table 7 ranks the top 10 survey questions by the degree of correlation (Kendall’s tau rank correlation (31), since the Likert scale is discrete) in their responses to three overall measures of satisfaction: Questions 2 (the biocurator’s subjective evaluation of the system), 7 (whether the biocurator would recommend the system) and Question 1 regarding whether the biocurator enjoyed using the system. This ranking is computed as follows: we first compute the median rating for each system on each question and then rank systems for each question by that median. We compute Kendall’s tau correlation between this ranking and the ranking of systems by the median rating for Questions 2, 7 and 1 and then take the average of the three resulting tau correlations. Note that these three questions are themselves very highly correlated (tau > 0.9, which is significant with P < 0.01). This was done for all filled surveys (38 total). It is clear from this table that task completion is very important, followed generally by the system’s usability.
Degree of correlation of top 10 questions to overall satisfaction measure
| Question | Correlation |
|---|---|
| Q4: personal experience | 0.719 |
| Q10: task completion efficiency | 0.622 |
| Q8: task completion speed | 0.569 |
| Q5: power to complete tasks | 0.568 |
| Q9: task completion effectiveness | 0.53 |
| Q23: consistent use of terms | 0.473 |
| Q6: flexibility | 0.443 |
| Q25: helpful error messages | 0.438 |
| Q15: learning to perform tasks | 0.431 |
| Q3: ease of use | 0.431 |
Finally, Table 8 gives an overall rating for each system for each group of questions (overall evaluation, task completion, system design, learnability, usability and recommendation) computed by taking the median value of all biocurator ratings for all questions in the group: overall evaluation (median of Questions 1–6), task completion (median of Questions 8–10), system design (median of Questions 11–14), learnability (median of Questions 15–19), usability (median of Questions 20–25) and recommendation (Question 7 alone). While systems generally score high for design, learnability and usability, it is clear from this table how important task completion is to the biocurators’ overall experience.
Overall rating for each system by category
| Subjective measure (overall median for each section) | ||||||
|---|---|---|---|---|---|---|
| System | Overall evaluation | Task completion | System design | Learnability | Usability | Recommendation |
| PubTator | 6.0 | 5.5 | 6.0 | 6.0 | 6.5 | 7.0 |
| eFIP | 6.0 | 6.0 | 6.0 | 6.0 | 7.0 | 5.5 |
| Tagtoga | 5.0 | 5.0 | 5.0 | 5.0 | 6.0 | 4.5 |
| Textpresso | 4.0 | 5.0 | 5.0 | 5.0 | 6.0 | 4.5 |
| PCS | 4.0 | 3.0 | 6.0 | 6.0 | 6.0 | 4.0 |
| PPInterFinder | 4.0 | 2.5 | 5.0 | 5.0 | 5.0 | 3.0 |
| T-HOD | 4.0 | 3.0 | 4.0 | 5.0 | 5.0 | 3.0 |
Median for questions linked for each of the categories. Likert scale from 1 to 7, from worst to best, respectively. aThis system was only reviewed at the workshop.
All teams benefited to an extent by participating in Track III, especially by the feedback received from biocurators (pre- and at the workshop). As a result, some of the teams have improved or are improving their systems, and others have engaged new communities. For example, in PPInterFinder, the ‘relation keywords’ list was refined to decrease the false positives and new patterns were added to PPI extraction methodology (22). PubTator (18) is planning to extend the bioconcepts being covered, as well as processing full-length articles, and T-HOD is extending the disease coverage (27). Finally, Textpresso engaged TAIR to similarly evaluate performance of Textpresso for cellular component curation of Arabidopsis gene products (14).
Discussion
The current IAT has been very challenging from multiple logistic aspects: recruitment and coordination of biocurators that can properly evaluate the systems; selection of datasets; issues of system readiness and data collection, formatting and processing. However, it is a great experience for both developers and users. Users are exposed to tools that may assist them in their curation; developers interact with potential users and learn about their real needs. We would like to point out that this activity covered different levels of annotation types that can be related to different biocuration strategies: document-centric and bio-entity centric biocuration as well as different level of granularity of the obtained results: from pure annotation relations between entities without textual evidence, and together with textual evidence at the level of phrases, sentences, passages and whole documents.
Below we describe some recommendations based on the lessons learned from this activity.
What is a biocuration task?
We found that it is important to align the views between biocurators and text mining groups on what constitutes a biocuration task, especially for those teams that do not work closely with biocuration groups. There are at least three aspects to consider which may influence the practical use of the text mining system: (i) in general, text mining systems should be more concerned with annotation guidelines as used in existing annotation workflows. We found that in some cases, even though teams provided guidelines, these did not follow necessarily the standards used by the representative databases (e.g. the definition of annotation types differs). On one hand, this may affect the system’s performance as the biocurator has to be ‘retrained’ to the new guidelines, but tends to follow his own, but more importantly, the output of the system may be incompatible with the annotation standards, and therefore it may not be used; (ii) another critical aspect is the system capability to provide flexible options to improve the interpretation of the extracted data, as this is key in biocuration. For example, displaying an isolated sentence without pointers to explore additional context information makes it hard for human interpretation and validation of text mining results and (iii) the third one is the aspect of output validation. Many of the text mining systems required validation of the results at the sentence level (in many cases validating redundant information), whereas the biocurator decides at the abstract/document level. In this context, the implementation of sentence/text ranking methods to select the more informative and representative sentences becomes crucial. We plan to provide more guidance about these topics to the teams in the next BioCreative.
What to compare?
In this ‘experiment’, we compared manual versus system-assisted curation to have a common baseline, but we are aware that this may not represent how a biocurator does literature curation in their curation workflow, and therefore it may impact the efficiency of the manual task (time it takes to complete the task). We think that this approach is still very informative and along with the biocurators’ feedback we should be able to better plan for BioCreative IV. It was very positive to find that many of the systems (4 out of 6) sped up curation in this comparison (Table 5). In addition, we had one case where a comparison between a curation tool and the same curation tool with text mining modules was made (Phenex with or without the CharaParser module). However, this option would be difficult to implement in a BioCreative setting if the intention is to engage a variety of users from different databases to try the systems. Alternatively, if systems could provide an interface where the user can activate or inactivate the use of a text mining tool while retaining other website functionalities, the result could be interesting to explore. Domeo (32) is an example of an annotation system in which the user can manually annotate a text or annotate automatically using a selected set of ontologies. In both cases, the annotations are saved in the same format (RDF) providing a way to easily compute metrics. This would also allow a better comparison of time on task. In this respect, ODIN (8) is a biocuration system that is able to record biocurators activities. We will explore some of these options in future discussion with the UAG.
System adaptability
This evaluation showed how the different systems could be adapted to assist the various database interests. For this particular experiment, many of the systems were tuned according to the curation group that evaluated them, for example, Textpresso adapted the system for the curation of articles for dictyBase, and this included close coordination with the database to identify the appropriate PDF articles about Dictyostelium and to import the gene name and synonym vocabulary, among other things. Similarly, PubTator included TAIR’s gene nomenclature to be useful for this database, and Charaparser was set up to work with the Phenex curation system. We should bear in mind that even when the systems are functional for a database, they may need some minor development to adapt it to a different user group. Therefore, we will be very mindful in allocating sufficient time for this in BioCreative IV.
Flexibility of Track III
To better learn the landscape of different tools, we opened this Track for any biocuration task. In fact, Table 1 shows how diverse were the tasks proposed by the participating systems. The activity was purposely designed to be flexible in many respects. First, regarding the metrics, we asked teams to suggest the appropriate metrics for their system. Most systems reported recall, precision and F-measure at different levels (sentence, document, etc). In addition, there were some particular measures for document ranking proposed as well as for inter-annotator agreement which might be interesting to explore as future standard metrics. Second, regarding system input, initially we proposed to have a PMID-centric approach for curation—given a set of documents, perform the task—because we wanted to expose the systems to a variety of examples. However, curation approaches vary so we also allowed other types of inputs. For instance, in PCS the input is a list of phenotypical characters in NeXML format (33), whereas other systems were gene-centric (e.g. PubTator, eFIP) or disease-centric (e.g. T-HOD). Finally, we did not request any specific format for the system output or the interface capabilities.
This flexibility, although it may increase the workload in terms of task planning, and data analysis, provides a great means to observe the approaches, standards and functionalities used by state-of-the-art systems. We believe results will aid in choosing appropriate metrics and standards for BioCreative IV challenges.
Engaging biocurators
Feedback from participating teams in the IAT of BioCreative 2012 workshop indicates that the participation of biocurators is one of the most valued aspects of this activity. In addition, recruitment of domain experts on the curation task is essential. In this regard, the coordinators from the IAT contacted many groups and consulted with teams to try to find the appropriate set of biocurators for each system, but the time frame, the lack of evident reward and other commitments were some of the barriers that prevented biocurators from participating in the pre-workshop evaluation. Based on this experience, we have now a better sense of the commitment needed by biocurators, and we expect that the UAG will serve not only by advising on BioCreative IV planning but also by providing insight on how to recruit biocurators or even serving as a source for biocurators. In this regard, the direct exposure of the UAG to the activity during the workshop has been an asset.
Finally, despite all the challenges, roadblocks and possible mistakes, both biocurators and text mining teams expressed interest in future participation in this activity. The IAT has served as a medium to experiment with different approaches to formally assess interactive systems. Similar to the BioCreative III IAT experience, we expect that the lessons learned will help to shape the future BioCreative IV task, not only to improve the IAT but also the challenge tracks that involve biocuration.
Acknowledgements
The authors would like to thank all the teams and the biocurators who participated in this activity.
Funding
National Science Foundation grant DBI-0850319; National Institutes of Health grant 5G08LM010720-02; The participation of Z.L. and W.J.W. was supported by the Intramural Research Program of the National Institutes of Health, National Library of Medicine. The participation of M.K was supported by CONSOLIDER grant CSD2007-00050 and MICROME grant 222886-2.
Conflict of interest. None declared.
References
Author notes
Citation details: Arighi,C.N., Carterette,B., Cohen,K.B., et al. An overview of the BioCreative 2012 Workshop Track III: interactive text mining. Database (2012) Vol. 2012: article ID bas056; doi:10.1093/database/bas056
