


Abstract
myPhyloDB v.1.1.2 is a user-friendly personal database with a browser-interface designed to facilitate the storage, processing, analysis, and distribution of microbial community populations (e.g. 16S metagenomics data). MyPhyloDB archives raw sequencing files, and allows for easy selection of project(s)/sample(s) of any combination from all available data in the database. The data processing capabilities of myPhyloDB are also flexible enough to allow the upload and storage of pre-processed data, or use the built-in Mothur pipeline to automate the processing of raw sequencing data. myPhyloDB provides several analytical (e.g. analysis of covariance, t -tests, linear regression, differential abundance (DESeq2), and principal coordinates analysis (PCoA)) and normalization (rarefaction, DESeq2, and proportion) tools for the comparative analysis of taxonomic abundance, species richness and species diversity for projects of various types (e.g. human-associated, human gut microbiome, air, soil, and water) for any taxonomic level(s) desired. Finally, since myPhyloDB is a local web-server, users can quickly distribute data between colleagues and end-users by simply granting others access to their personal myPhyloDB database. myPhyloDB is available at http://www.ars.usda.gov/services/software/download.htm?softwareid=472 and more information along with tutorials can be found on our website http://www.myphylodb.org .
Database URL:http://www.myphylodb.org
Introduction
The advent of next-generation-sequencing has resulted in the rapid growth of metagenomic studies across a wide range of ecosystems. However, this increase in data generation capacity has resulted in the need for appropriate data stewardship procedures. While considerable effort has focused on archiving data in public databases (e.g. Short Read Archive (SRA)), this raw data is not in an easy to use format, nor is it designed to facilitate comparative studies. Similarly, there has been a dramatic increase in the software tools available to process and analyse metagenomics data (e.g. Mothur ( 1 ), QIIME ( 2 ), MEGAN ( 3 ), METAGENassist ( 4 ), MG-RAST( 5 ) and Integrated Microbial Genomes (IMG)( 6 )). Comparative and/or cross-location studies can provide unique insights into the relationships driving microbial community structure and function. For example, national networks have been implemented in a variety of natural (e.g. LTER, NEON) and managed (e.g. GRACEnet, LTAR) systems; although, some of the tools mentioned above could potentially be used to compare microbial distribution and abundance across these networks they are either difficult to use and/or do not provide data standardization and normalization across projects, which is one of the main goals of myPhyloDB. For example, myPhyloDB is unique in that (i) it provides a standardized set of metadata variables for each project type, (ii) offers a wide variety of normalization techniques, (iii) provides user-customizable pipelines that can be easily applied to all projects and (iv) is a personal web server and database under the direct control of its users. As such, myPhyloDB is designed to be a building block for small-scale private, and public, institutions and laboratories to develop their own personal web-server for data analysis and its distribution to users.
myPhyloDB was designed to be a user-friendly personal web-based application to facilitate the storage of databases for improved handling, processing, analysis and distribution of metagenomics data. myPhyloDB’s goal is not necessarily to develop new analytical tools; rather, the goal is to complement currently available metagenomics tools (e.g. Mothur, R) with database capabilities and a user-friendly graphical user interface (GUI) to facilitate the analysis and comparison of metagenomics studies from different projects and focus areas (e.g. human, air, soil and water). At a minimum, we envision that researchers and private consultants at service laboratories will utilize myPhyloDB to (i) facilitate the storage of their sequencing data, (ii) standardize sequencing pipelines across all projects and (iii) enable cross-study and meta-analysis of soil biodiversity and function. In addition, since many researchers, and potential users, of metagenomics data are not necessarily highly trained computer programmers, we have focused on providing the user with an easy to use program built around a web browser interface that includes all necessary software dependencies internally. In other words, myPhyloDB has no software dependencies for the end-user to worry about, such that one can simply log in and begin working with data.
Program description
myPhyloDB utilizes a GUI and should be easy to navigate for anyone familiar with using a normal web browser. Additional information on running myPhyloDB can be found at our website ( www.myPhyloDB.org ) in the tutorials section or a PDF version of the myPhyloDB manual. The actual implementation is a Python application built using the Django framework and a MySQL database for long-term storage. myPhyloDB’s data storage, curation and analysis are performed using taxonomic levels and names. This is driven, in part, due to potential differences in sequencing information (i.e. gene sequenced, PCR primers utilized, read length etc.); and the difficulties in defining and curating a systematic naming convention for operational taxonomic units (OTUs) based on genetic distance across projects. In addition, only the seven major taxonomic classifications (i.e. Kingdom, Phyla, Class, Order, Family, Genus and Species) are supported.
Installation and setup
myPhyloDB is built for 64-bit desktops running Windows (7 and up) or Linux (Ubuntu 14.04 tested only) operating systems. Either version can be easily installed through the use of the available installation programs, which can be obtained from: http://www.ars.usda.gov/services/software/download.htm?softwareid=472 . The current version, described in this article, is v.1.1.2. Once installed, a local copy of myPhyloDB can be started by clicking on the appropriate launcher, which should also open a browser to the myPhyloDB home page: http://127.0.0.1:8000/myPhyloDB/home/ . Additionally, users on your local area network may also access myPhyloDB through its web-server capabilities. To access myPhyloDB from a remote computer, enter the following address in your favorite browser, xxx.xxx.xxx.xxx:8000/myPhyloDB/home/, where the x’s are the actual IP address of the host machine running myPhyloDB.
Home screen and sidebar
Navigation between the various pages and analyses provided by myPhyloDB is performed using the Menu sidebar at the left of the screen ( Figure 1 ). The menu sidebar is split into four sections: General Info, Data Mgt, Taxonomy and Analysis. myPhyloDB’s home page screen provides general information about myPhyloDB, as well as links to the instruction manual, example datasets and sample template files required for uploading new projects into myPhyloDB.
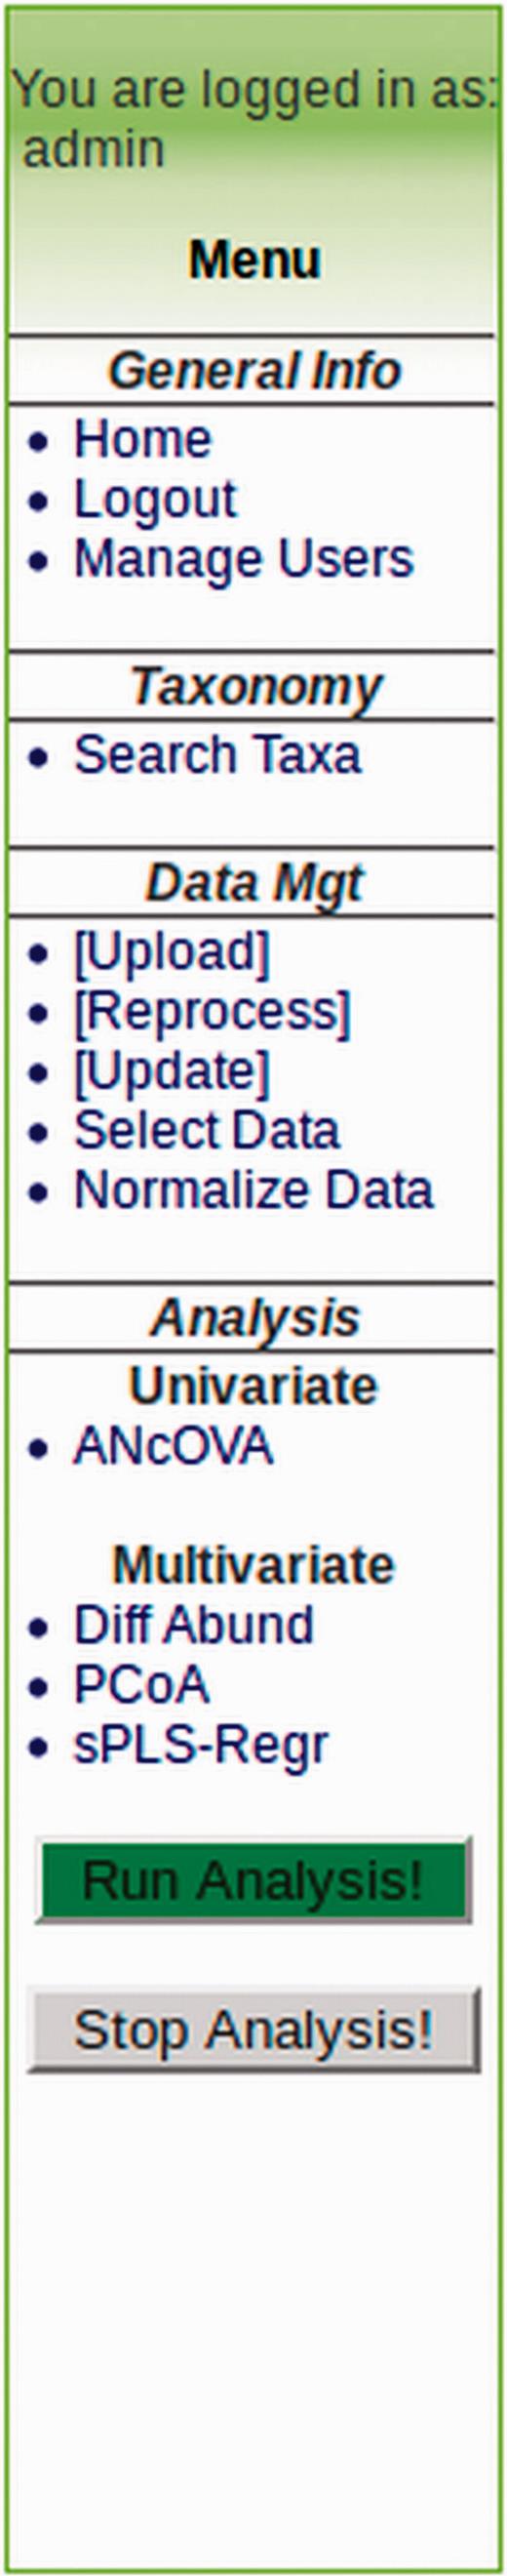
Example menu sidebar for general navigation between myPhyloDB pages and analyses.
DataMgt
The DataMgt pages allow users to upload, reprocess, updateor select data for analysis. myPhyloDB is pre-packaged with one example dataset (Example 1) already uploaded to the databases; however, four different example datasets can be found at our website. Example 1 uses Mothur ( 1 ) pre-analysed files, example 2 uses raw 454 pyrosequencing files (sff format), example 3 uses raw fna/fastq files that can be obtained from the 454 or Illumina platforms and example 4 uses fastq files available from the Illumina platform. All of the files required to upload these example projects can be obtained from the myPhyloDB homepage or our website. To upload new data into myPhyloDB, click ‘[Upload Data]’ on the left hand menu. For security purposes, all DataMgt pages can only be accessed by authorized users, which can be easily managed through the ‘Manage Users’ page.
For all uploads you will need to provide the appropriate sequence data files along with a single metadata (e.g. myPhyloDB.Soil.meta.xls) file using the Excel templates provided. Additional instruction for using the Excel templates is contained within each file. For your convenience sample files are tailored to several different project types (soil, human-associated, air, water and microbial) based on recent standards developed by the Genomic Standards Consortium ( 7 ). Please note that MyPhyloDB does not perform any unit checking or conversion of data so consistent units should be used for all Projects and Samples.
Currently myPhyloDB supports the upload of data in four formats: Mothur pre-processed data, raw 454 pyrosequencing (sff) files, raw Illumina/MiSeq (fastq) files and fna/fasta files. Examples of these files can be found on the home page along with additional instructions for generating the necessary Mothur files in the instruction manual. The upload and processing of raw data utilizes an embedded copy of Mothur (v.1.35.1), and through the use of an editable batch file can be tailored to fit any desired sequencing pipeline. However, the default batch files provided should be suitable for most users’ needs and are based on the current Mothur 454 and MiSeq SOPs ( 8 ).
myPhyloDB also provides two additional DataMgt pages for modifying data already unploaded into myPhyloDB. The first ‘[Reprocess]’ allows users to (i) conveniently upload any new reference files (e.g. RDP, SILVA etc.) necessary for the alignment and classification of sequence data and (ii) reprocess previously uploaded projects using any reference file of the user’s choice. The second page ‘[Update]’ allows the user to conveniently edit/update the metadata associated with any project/sample already uploaded into myPhyloDB.
Data selection and normaliztion
The first step to performing an analysis with myPhyloDB is to navigate to the ‘Select Data’ page where any combination of projects and/or samples can be selected using the selection tree ( Figure 2 ). By default, if a Project checkbox is selected all samples for that project will also be selected. Each project can be expanded and individual samples can be manually selected/deselected. The project/sample tree is organized by project and sample names; however, the project and sample descriptions can be viewed by hovering the mouse over the appropriate name. Once you have selected some projects/samples for analysis, the sidebar show the “Normalize Data” page, which is used to normalize all sample reads to a common sampling depth.
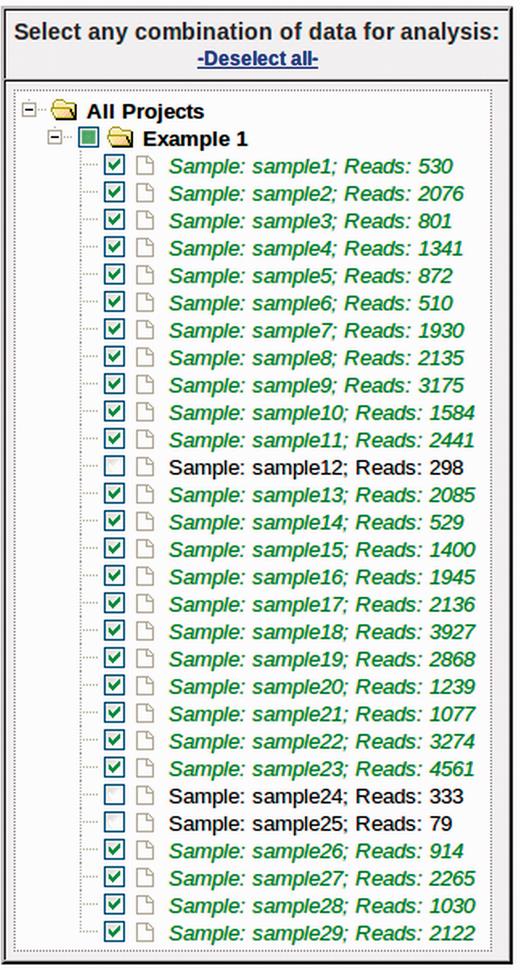
Data selection tree from ‘Select Data’ page. Any combination of projects and samples can be selected using the appropriate checkboxes. Under each project (folder), samples are listed by its sample name (Sample) and the number of sequence reads (Reads).
myPhyloDB currently provides five different normalization techniques [none, rarefaction (remove), rarefaction (keep), proportion and DESeq2]. The effect of sampling depth can have a large impact on both univariate and multivariate analyses, as discussed previously ( 9 , 10 ). A brief description of each procedure is as follows:
None: no normalization is performed.
Rarefaction (remove): this normalization procedure performs a typical sub-sampling with replacement to the desired sub-sample size, as implemented in Mothur and QIIME. Any sample, with fewer reads than the desired setting will be removed from the analysis. In the text box provided one can enter ‘min’, ‘median’, ‘max’ or any integer for the desired sample size.
Rarefaction (keep): this normalization procedure also performs a sub-sampling without replacement to the desired sub-sample size; however, it will keep all selected samples in the analysis regardless of the initial sample size. Aguirre de Cárcer et al. ( 11 ) suggest that sub-sampling to the median number of sequence reads in a dataset can reduce variability and improve analysis. However, for samples with coverage below the sub-sampling threshold, no normalization procedure was proposed. In order to maintain sampling depths across all samples, myPhyloDB applies a small probability to undetected taxa (i.e. zeros) using a modified additive (Laplace) smoothing technique ( 12 ) with λ = 0.1. The purpose of this small probability is to account for the uncertainty associated with not knowing whether the missing taxa were truly not present, or present but below the detection level, in the observed data. The Laplace approximated probabilities are then sampled to a user-defined sample size to generate a new taxonomic profile for each sample. In the text box provided you can enter ‘min’, ‘median’, ‘max’ or any integer for the desired sample size.
Proportion: all taxonomic counts are divided by the total number of sequence reads for that sample.
DESeq2: please refer to the DESeq2 manual ( 13 )
Your selected projects/samples and normalized data are saved to a ‘cookie’ and will be available for all subsequent analyses provided by myPhyloDB. All project/sample information and normalized taxonomic data can also be output to tabular of BIOM ( 14 ) formats. The tabular output consists of a DataTable (Spry Media, Ltd.), which provide users with the ability to easily sort, filter, search and export their data. For users interested in conducting additional analysis with raw data in other platforms (e.g. Mothur, QIIME, Retc.) this is the only analysis page that offers raw data (i.e. meta data and taxonomic abundance) export in both tabular and BIOM formats. Once you have selected and normalized the samples you would like to analyse, under the ‘Analysis’ heading on the menu sidebar select the type of analysis you would like to perform.
Analysis of covariance
ANcOVA (analysis of covariance) can be run in two different fashions in myPhyloDB. When the ‘Bar plot (factors)’ option is selected, myPhyloDB performs an ANcOVA (i.e. comparison of factors), which may be run with, or without, user-specified covariates. Once the analysis is successfully completed, a bar graph and ANOVA table will be displayed. If the ‘Scatter plot (regression)’ option is selected, myPhyloDB performs a linear regression analysis (i.e. comparison of the regression slopes and intercepts), which may be run with, or without, user-specified dummy variables. Once the analysis is successfully completed, a scatter plot with regression lines and ANOVA table will be displayed. All ANcOVA analyses are conducted using R (R Project for Statistical Computing, http://www.r-project.org ) and the linear regression coefficients required for plotting are calculated using SciPy ( 15 ). Additional information on the individual R commands used can be found on our website. Dependent variables available for analysis are taxonomic abundance, total abundance (rRNA gene copies), species richness and species diversity (i.e. Shannon’s Diversity Index). Please note that total abundance (rRNA gene copies) requires an independent estimate of total rRNA copies in your sample, using a technique such as quantitative PCR ( 16 ), and unless such data are added to your Excel metadata file analyses with total abundance will not be available.
Metadata variables can be selected from the checkbox tree ( Figure 3 ). For categorical data, multiple variables may be selected for analysis. For example, if one variable is selected, myPhyloDB will perform a one-way ANOVA, if two variables are selected, a two-way ANOVA will be performed, etc. For quantitative data, only a single meta-variable can be selected at any given time due to potential unit conflicts. Grouping of data within the metadata tree is by variable, followed by level(s) of that variableand samples belonging to that level. For the user’s convenience each sample is listed by its name and the number of sequence reads associated with that sample.
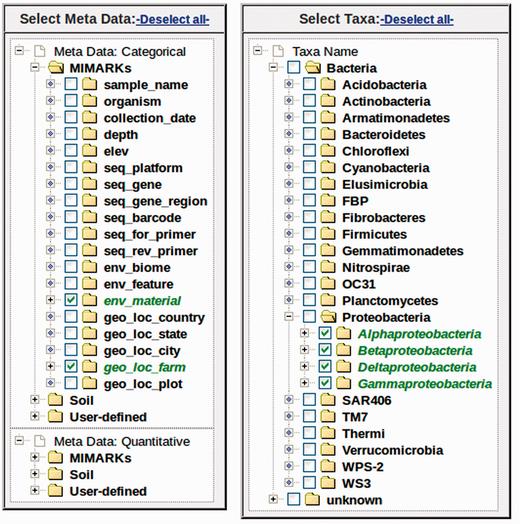
Example metadata and taxonomic selection trees. Any combination of metadata can be selected using the appropriate checkboxes. Under each variable, samples are listed by its sample name (Sample) and the number of sequence reads (Reads). The taxonomic tree is organized by taxonomic rank (first level: Kingdom, second level, Phyla etc.). Any combination of taxa can be selected using the appropriate checkboxes.
Current programming restraints require that all samples for a selected variable/level combination will be included in the analysis; however, individual samples can be selected/deselected using the ‘Select Data’ page. The selection of microbial taxa for analysis can be selected based on taxonomic level (e.g. all taxa present at the selected level) or for any combination of individual taxa using the ‘Select Taxa’ tree. This graphical interface is unique to myPhyloDB and provides an unparalleled level of flexibility for analysing microbial data by taxonomy. Once the analysis is complete, myPhyloDB will display the appropriate graph (e.g. Figure 4 ) and test results at the bottom of the page.
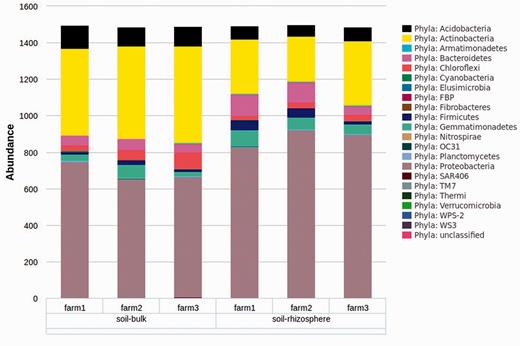
Example graph output from an ANcOVA analysis. Bar graphs are the mean taxonomic abundance for each level of the chosen meta-variable and taxa.
Diff abund
‘Diff Abund’ performs a differential abundance analysis of count data using the DESeq2 package in R ( 13 ). Unlike the ANcOVA page all taxa for the selected taxonomic level will be analysed in a single run. Once the analysis is complete, myPhyloDB will display a scatter plot of log2FoldChange and a table of results from the associated negative binomial test.
Principal coordinates analysis
The ‘PCoA’ (Principal Coordinates Analysis) analysis page layout and operation is similar to the Univariate analyses; however, taxonomic data can only be selected based on taxonomic level and metadata is selected using the ‘Meta Data’ tree. Currently, 15 different distance scores/indices are available in myPhyloDB. All of the scores are calculated using SciPy, except wOdum ( 17 ). The PCoA analysis is a partially constrained PCoA using the capscale function in the R vegan package ( 18 ). Two statistical tests are also offered in myPhyloDB, perMANOVA (adonis) and betaDisper, both utilizing the R vegan package. Once the analysis is complete, myPhyloDB will display the test results in tabular form (e.g. perMANOVA table) along with the PCoA eigenvalues, a table of the principal coordinate axes and a matrix of distance scores. Each table can be easily exported using the available buttons.
Sparse partial least squares regression
The layout and operation of the sPLS (sparse partial least squares regression) analysis page is also similar to the Diff Abund page, except for the addition of two plotting options and drop-down menus. The sPLS analysis is run using the sPLS package of R ( 19 ) and is a useful technique for the simultaneous dimension reduction and variable selection ( 20 ). This makes sPLS a good choice for identifying important predictor variables among a large number of predictors in highly dimensional data, such as microbial communities. sPLS analysis will produce an heatmap (Highcharts option) or clustered heatmap (R plot option) of the sPLS correlation coefficients.
Taxonomy
myPhyloDB also provides a ‘Search Taxa’ page to allow users to facilitate the exploration of the taxonomic data contained in your myPhyloDB database. The ‘Taxa name’ textbox at the top of the page allows users to quickly search various web engines with a user-inputted taxa name. The DataTable contains the full taxonomic name of each taxon in your database ( Figure 5 ). For each taxonomic level a unique ID is generated by myPhyloDB for internal tracking purposes and to avoid confusion if duplicate taxonomic names exist. All analysis results in myPhyloDB will include both taxonomic names and IDs which can be used to identify full taxonomic profiles using this data table. You can also export the table data to CSV, Excel, or PDF files or send the data directly to a printer.
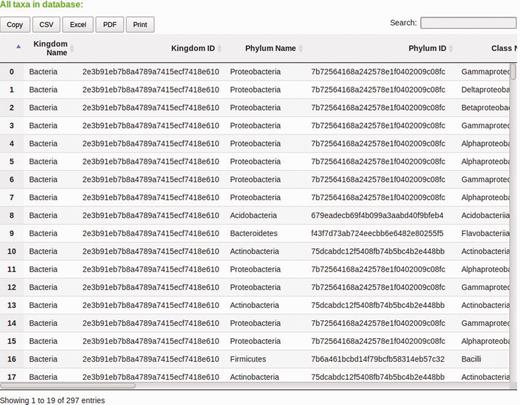
DataTable from the ‘Search Taxa’ page. myPhyloDB uses DataTables on a number of its pages to display data. DataTables are searchable, sortable and exported using the links provided.
Availability and requirements
myPhyloDB is open access and the source code can be found at https://github.com/manterd/myPhyloDB . The official myPhyloDB release and installation files for 64-bit Windows and Linux platforms can be obtained from http://www.ars.usda.gov/services/software/download.htm?softwareid=472 . A website with more information and tutorials on using myPhyloDB can also be found at http://www.myphylodb.org . myPhyloDB has been fully tested on 64-bit Windows 7/8 and Ubuntu 14.04 operating systems and has no additional software requirements or dependencies. In theory, myPhyloDB can handle an unlimited amount of data. However, actual limitations will be dictated by your computer’s RAM and hard disk space with much of the potential limitation occurring during sequencing processing (i.e. running of mothur pipelines). We provide four example datasets at the myPhyloDB website ( http://www.myphylodb.org ), each was successfully uploaded and processed by myPhyloDB using a Dell Venue 11 Pro tablet running Windows 8.1 Pro with 4GB of RAM and an Intel i5-4210Y CPU.
Conclusion and future directions
myPhyloDB is at the forefront of metagenomics data handling and analysis, is easy to use, and provides a large set of capabilities. Its implementation and adoption is expected to improve communication both within the scientific community and with end-users. There are several national programs conducting research related to the soil, plant and human metagenomes; however, there is not a system to facilitate the storage, handling and analyses of metagenomics data for these critical national programs. Although, myPhyloDB is a user-friendly personal database, it is envisioned that it will serve as the basis for a hosted web-server for the deposition of metagenomic data. For example, the USDA-ARS National Program 212 (Soil and Air) Action Plan proposed the development of a national database on soil biology and metagenomics. The USDA-ARS Soil-Plant-Nutrient Research unit’s myPhyloDB could contribute to this national effort by serving as the basis for a cross-program (e.g. human, soil, air, water) and/or cross-location database to store and analyse metagenomic data.
We also propose that there is a need to integrate currently available soil databases (e.g. GRACEnet) with additional data on soil biology to provide additional insight into the factors contributing to soil function(s). We propose that myPhyloDB with its emphasis on data storage, method standardization and analysis will provide a strong foundation for the integration and coordination of these national databases. Expanding the availability, use and integration of data from multiple sources is also critical to facilitate regional and national analyses of the effects of management on soil biology and soil health.
Acknowledgements
The authors are grateful to the laboratory of Dr. Tiffany Weir, Colorado State University, for providing valuable testing and feedback on the design of myPhyloDB. This article was the work of US government employees engaged in their official duties and is exempt from copyright.
Conflict of interest . None declared.
References
Author notes
Citation details: Manter,D.K., Korsa,M., Tebbe,C., et al. myPhyloDB: a local web server for the storage and analysis of metagenomic data. Database (2016) Vol. 2016: article ID baw039; doi:10.1093/database/baw039
