


Abstract
Fully automated text mining (TM) systems promote efficient literature searching, retrieval, and review but are not sufficient to produce ready-to-consume curated documents. These systems are not meant to replace biocurators, but instead to assist them in one or more literature curation steps. To do so, the user interface is an important aspect that needs to be considered for tool adoption. The BioCreative Interactive task (IAT) is a track designed for exploring user-system interactions, promoting development of useful TM tools, and providing a communication channel between the biocuration and the TM communities. In BioCreative V, the IAT track followed a format similar to previous interactive tracks, where the utility and usability of TM tools, as well as the generation of use cases, have been the focal points. The proposed curation tasks are user-centric and formally evaluated by biocurators. In BioCreative V IAT, seven TM systems and 43 biocurators participated. Two levels of user participation were offered to broaden curator involvement and obtain more feedback on usability aspects. The full level participation involved training on the system, curation of a set of documents with and without TM assistance, tracking of time-on-task, and completion of a user survey. The partial level participation was designed to focus on usability aspects of the interface and not the performance per se. In this case, biocurators navigated the system by performing pre-designed tasks and then were asked whether they were able to achieve the task and the level of difficulty in completing the task. In this manuscript, we describe the development of the interactive task, from planning to execution and discuss major findings for the systems tested.
Database URL:http://www.biocreative.org
Introduction
BioCreative: Critical Assessment of Information Extraction in Biology is an international community-wide effort that evaluates text mining (TM) and information extraction (IE) systems applied to the biomedical domain (1–5). A unique characteristic of this effort is its collaborative and interdisciplinary nature, as it brings together experts from various fields, including TM, biocuration, publishing and bioinformatics. Therefore, evaluation is tailored towards specific needs of these communities. BioCreative has been working closely with biocurators to understand the various curation workflows, the TM tools that are being used and their major needs (6, 7). To address the barriers in using TM in biocuration, BioCreative has been conducting user requirements analysis and user-based evaluations, and fostering standards development for TM tool re-use and integration. The BioCreative Interactive text mining Task (IAT) introduced in BioCreative III (8, 9) has served as a means to observe the approaches, standards and functionalities used by state-of-the-art TM systems with potential applications in the biocuration domain. The IAT task also provides a means for biocurators to be directly involved in the testing of TM systems. IAT consists of demonstration and evaluation of web-based systems addressing literature curation tasks, evaluated by biocurators on performance and usability. One of the main goals is to collect data from biocurators testing the systems, and provide useful feedback to developers on possible enhancements and how to better tailor their system for biocuration. The benefits are multifold, including: direct communication and interaction; exposure to new TM tools that can be potentially adapted and integrated into the biocuration workflow, contribution to the development of systems that meet the needs of the biocuration community and dissemination of findings in proceedings and peer-reviewed journal articles. A User Advisory Group (UAG, http://www.biocreative.org/about/biocreative-v/user-advisory-group), representing a diverse group of users with literature-based curation needs, has been assisting in the design and assessment of the IAT. In particular, in BioCreative V the UAG was engaged in multiple aspects of the task, including preparing the requirements for the systems, reviewing the user survey, recruiting biocurators and testing the systems. Some tasks proposed in IAT build on previous BioCreative outcomes. For example, BioCreative IV included a panel session, sponsored by the Department of Energy (DOE), on the TM needs of the metagenomics community which studies the genetic material recovered directly from environmental samples. The discussions from this session inspired the participation of a team in the IAT task specifically to address the extraction of environmental and species metadata from free text. Similarly, three teams that participated in BioCreative IV, participated again in BioCreative V with their systems presenting enhancements based on feedback from previous participation.
It is worth noting that the interactive activities have gained traction in the last few years, beyond BioCreative context. For example, in recognition of potential barriers that may inhibit the widespread adoption of biomedical software, the 2014 i2b2 Challenge introduced a special track, Track 3—Software Usability Assessment, which highlighted usability issues and therefore limitation of use/adoption of biomedical software (10). Also, in parallel to IAT track, BioCreative V has introduced the Collaborative Biocurator Assistant Task (BioC) (11), which explores the integration of the BioC format (12) output from different TM modules to provide a system for literature curation of protein–protein interactions tailored for the BioGrid Database (13).
The current article describes the IAT task, the workflow of the IAT activities, the participating TM systems and the results from the user evaluation.
Methods
Call for participation: systems and user recruitment
Teams were invited to present a web-based system that could address a biocuration task of their choice. The systems were expected to follow the requirements proposed in the call for participation (CFP, http://www.biocreative.org/tasks/biocreative-v/track-5-IAT). Selection of participating systems was based on the evaluation of a document containing the description of the system, including the relevance of the proposed task to the targeted community, use of standards (vocabularies and ontologies) and baseline performance evaluation of the system or its components.
In addition, we invited biocurators to participate in the evaluation of such systems via the International Biocuration Society mailing list, and with the help from UAG members. This user study was conducted remotely. Two levels of participation were offered: full (total commitment time of approximately 12 h per system) which involved training, performing pre-designed tasks, curating a set of documents and completing a user survey; and partial (total commitment time of approximately 30 min to 1 h per system) which involved performing basic pre-designed tasks at the system's website, and providing feedback via a user survey. The timespan to complete the activity was 6 weeks. Table 1 shows the suggested timeline for the full level participation activity.
IAT activity workflow suggested to biocurators committed to full level participation
| Week | Activity |
|---|---|
| Week 1 | Training with guided exercises with TM team |
| Week 2 | Review of task guidelines with TM team and coordinator. |
| Week 3 | Pre-designed tasks exercise |
| Week 4 | 1 h annotation (non-TM assisted) and 1 h annotation (TM-assisted) |
| Week 5 | 1 h annotation (non-TM assisted) and 1 h annotation (TM-assisted) |
| Week 6 | Survey and submission of data |
The schedule was presented to teams and curators as a guide to plan the different steps of the IAT activity. It was important to follow the order of these steps, whereas the time devoted to each could vary depending upon the curator’s availability. However, by the end of Week 6 all surveys and data should be submitted.
Evaluation
Survey software
For the usability test and surveys, we reviewed and followed guidelines outlined in usability websites (e.g. http://www.usability.gov). All surveys and activities were prepared and presented to the user via the SurveyMonkey interface (https://www.surveymonkey.com) and responses were collected in CSV format. Surveys were based on a five-point Likert-type scale (14). User responses to survey questions were converted from a semantic scale to a numerical scale of 1–5, ranging from most negative to most positive feedback, respectively.
All the pre-designed tasks and surveys described in this section can be accessed from the BioCreative website (IAT Surveys, http://www.biocreative.org/media/store/files/2015/IATsystemsurveys2015.pdf and Supplementary File S1).
Pre-designed tasks with survey
A collection of pre-designed tasks was prepared for each system with feedback from the participating teams. With previous consent, we asked all users to perform these tasks with the system of their choice and encourage them to navigate and provide initial feedback on their overall impressions about the system. Examples of pre-designed tasks included: (i) accessing the TM tool, (ii) testing general functionality (such as searching and sorting), (iii) finding documentation, (iv) editing capability, (v) saving results and (vi) understanding semantics of icons/buttons/tabs. Each task was followed by questions on the user’s ability to complete the task and difficulty in accomplishing the task. At the end, we asked some general questions about the system, such as perception of assistance in the biocuration task proposed, and feedback for improvements, followed by a set of questions to address usability, and user satisfaction questions (rating experience with the system, and likeliness to recommend the system to others).
In the pre-designed task, we computed the following.
Task completion (percentage of users who completed a task); task difficulty (from those who completed the task, what percentage found the task difficult) and task confidence (from those who completed the task, what percentage felt not confident about task performance).
Overall system assessment: In the case of the responses to the general questions about the systems, the data were aggregated for each category (e.g. straightforward use) and represented in terms of percentage of positive (with score > 3), negative (with score < 3), neutral (with score = 3) and skipped (questions not responded or not applicable) responses. For investigating the possible correlation between the different questions the following correlation coefficients were calculated: Spearman Rho and Kendall Tau (http://www.wessa.net/rwasp_kendall.wasp).
Net Promoter Score (NPS): It is used to learn about user satisfaction, in this case the system recommendation to others. NPS was directly calculated by the SurveyMonkey software. For computing NPS, a customer loyalty metric from 1 to 10 is used for denoting detractors (1–6), neutral (7, 8) and promoters (9, 10). Subtracting the percentage of Detractors from the percentage of Promoters yields the NPS, which can range from a low of −100 (if every user is a Detractor) to a high of 100 (if every user is a Promoter).
Central Tendency for system rating: the median for system rating question along with the maximum and minimum values were calculated using Excel software.
Full level participation
A set of documents were selected for the curators to annotate with or without the TM assistance. After the annotation step the user filled in a user survey that was modified version from that in BioCreative IV (15) to include the questions needed to calculate the System Usability Scale (SUS) (16) score. The SUS is composed of ten statements, each having a five-point scale that ranges from Strongly Disagree to Strongly Agree, alternating positive and negative statements. A score of 68 is considered average in benchmark of 500 studies, thus SUS scores higher than 68 can be considered above average. Questions 4 and 10 provide also a measure of learnability. Following previous IATs, we also included the set of questions for the following categories: (i) comparison to similar systems, (ii) system's ability to help complete tasks, (iii) design of application and (iv) other usability aspects. For each of the systems, responses from users were aggregated for all questions related to a given category.
In the full level participation task, we computed the following.
Survey-based metrics
System Usability Scale (SUS) (16): To calculate SUS we followed standard guidelines (SUS, http://uxpamagazine.org/sustified/), namely, (i) for odd-numbered questions: value = response-1, (ii) for even-numbered questions: value = 5-response, (iii) SUS = 2.5 × (∑values).
Central tendency calculation for pooled survey responses: The central tendency was calculated using the median, the minimum and maximum values for the set (Min and Max, respectively), along with the 25% or lower quartile (splits off the lowest 25% of data from the highest 75%, Q1) and the 75% or upper quartile (splits off the highest 25% of data from the lowest 75%, Q3).
Performance metrics
Curation throughput: This metric includes the number of annotations and/or documents curated per time unit. This time was recorded for the TM assisted and the TM non-assisted curation separately by the curators themselves, and reported back to the teams. In some cases, the systems have the capability to track time on task.
Inter-Annotator Agreement (IAA): IAA was calculated for curators working on overlapping sets of documents. This measure was calculated by the teams via pairwise comparisons of annotations.
Precision/Recall/F-score: Some of the systems calculated the Precision (P), Recall (R) and their harmonic means (F-score) to compare the performance of the system against the curators, as follows:
P = TP/(FP + TP)
R = TP/(FN + TP)
F-score= 2 (P × R)/(P + R)
Where TP and FP stand for true positive and false positive, respectively; and FN for false negative.
Results and discussion
Systems and user recruitment
Seven international teams participated in the IAT. Table 2 summarizes some aspects of the participating systems. The systems cover a variety of curation steps in the literature curation workflow, namely triage (selection of relevant articles), entity detection (identification of relevant bioentities in text with/without linking to entities in corresponding databases) and relation/evidence extraction (capture the relations between bioentities and evidence for such relations). Gene and disease/phenotype annotation theme was prevalent (5 out of 7 systems). However, there was a great variability in the complexity of the systems in terms of the task proposed (Table 2 under column ‘Description’) and the overall system capabilities. In the former case, the simplest task included the detection of bioentities in text with links to appropriate vocabularies [e.g. EXTRACT (17) and Ontogene (18)], others also captured relations between the bioentities [e.g. Argo (19, 20), MetastasisWay (21), egas (22, 23)] and the most complex one included, in addition, the representation of the extracted information in structure language (e.g. BELIEF). Also, the system capabilities varied even within a similar type of task, some offered workflow design options, where the user can build customized TM workflows [e.g. Argo (19, 20)]; management systems for curation, where a user can monitor and compare the different annotations [e.g., egas (22, 23) and BELIEF], plug-ins/bookmarklets for the web browser [e.g. EXTRACT and MetastasisWay (21)] and network visualization [e.g. GenDisFinder (24) and MetastasisWay]. In terms of the text selected for text mining, three of the seven systems offered full-text processing for the task. However, other systems also have the capability to use full-text (egas) or even any text as long as it is presented in a browser (EXTRACT). Finally, in terms of the browser compatibility, which is important at the time of testing the systems, majority of the systems were reported to be compatible with Chrome (all systems) and Firefox (6 out of 7).
Summary of IAT participating systems
| System | Description | Bioconcepts | Link to Standards | Curation workflow step | Relations captured | Text | Browser |
|---|---|---|---|---|---|---|---|
| Curation of phenotypes relevant to the chronic obstructive pulmonary disease (COPD) |
|
|
|
|
|
|
| BELIEF | Semi-automated curation interface which supports relation extraction and encoding in the modeling language BEL (Biological Expression Language) |
|
|
| Relations expressed in BEL. Relations can be expressed between all of the detected entity types |
|
|
| egas | Identification of clinical attributes associated with human inherited gene mutations, described in PubMed abstracts |
|
|
|
|
|
|
| EXTRACT | Lists the environment type and organism name mentions identified in a given piece of text |
|
|
|
|
| |
| GenDisFinder | Knowledge discovery of known/novel human gene-disease associations (GDAs) from biomedical literature |
|
|
|
|
|
|
| MetastasisWay (MET) | Look for the biomedical concepts and relations associated with metastasis and finally construct the metastasis pathway. |
|
|
| positive and negative regulations between biomedical concepts associated with metastasis |
|
|
| Ontogene | Curation of bioconcepts, such as miRNA, gene, disease and chemicals and their relations. |
|
|
|
|
|
The columns from left to right indicate: (i) name of the system, (ii) description of the system in relation to the biocuration task proposed, (iii) bioconcepts (what entities are detected, e.g. gene, disease), (iv) standards adopted by the system to link the bioconcepts detected to corresponding databases and ontologies, (v) what step of the literature curation workflow the system helps with, (vi) the relations captured include relations between bioconcepts (e.g. relation between gene-disease), (vii) the text column lists what type of text the systems are able to process and (viii) the browser column indicates the system compatibility with web browsers.
With the help of the UAG and the teams, we were able to recruit a wide variety of biocurators worldwide. A total of 43 biocurators participated in the IAT in different capacities. Figure 1 shows the distribution by geographical location (Figure 1A), examples of type of database or institution represented (Figure 1B), and distribution by system and level of participation (Figure 1C). All systems were inspected by at least seven biocurators at some level (full/partial).
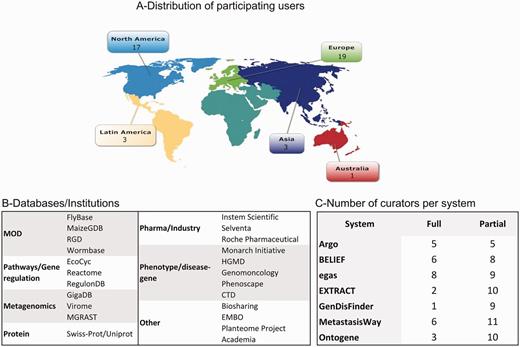
Distribution of biocurators (A) by geographic area, (B) by type of database/institution, and (C) by level of participation. A total of 43 biocurators participated in this activity. Notice that the total number in (C) is higher because some biocurators tested more than one system, and all curators participated in the partial activity.
Evaluation
It should be noted that the IAT activity is a demonstration task, which yields qualitative rather than quantitative results. In addition, given the diversity of biocuration tasks proposed and varied complexity of the systems, the results should not be directly compared, but taken each within its specific context. Therefore, we present the data highlighting some general trends or important differences.
Pre-designed tasks
The pre-designed task activity was customized for each system. By reviewing the answers to questions about the ability to complete the task, its difficulty, and confidence on the task performance, specific problems with the system can be identified. Table 3 shows the percentage of users who completed each task per system (n/a means we have no data for that field). In general, users were able to accomplish the tasks requested. Some cases where users failed to accomplish tasks were related to: inability to install or access the system; functionality that did not work properly; the formatting of the input text and, in a few cases, the user simply did not understand the task. For example, in the case of the BELIEF system (25), which produces expressions in BEL (Biological Expression Language, http://www.openbel.org/), some of the users reported that they were unfamiliar with BEL, and therefore, felt less confident in some of the tasks (e.g. editing and exporting the statements).
Results on task completion in the pre-designed tasks for each system
| TASK | % users completed task | Based on those who completed task | |
|---|---|---|---|
| % found it difficult | % not-confident | ||
| Argo (5 curators) | |||
| TASK1-Launching Argo | 100 | 0 | 0 |
| TASK2-Find the page with tutorial for curation task | 80 | 0 | 0 |
| TASK3-Managing files in Argo | 100 | 0 | 0 |
| TASK4-Open a file | 80 | 25 | 0 |
| TASK5-Edit annotations | 80 | 25 | 0 |
| TASK6-Saving annotations | 80 | 25 | 0 |
| BELIEF (8 curators) | |||
| TASK1-Find information about BEL | 100 | 13 | 13 |
| TASK2-Find and open project. Understanding content of page | 100 | 0 | 13 |
| TASK3-Edit the BEL statements and select for export | 75 | 33 | 17 |
| TASK4-Export the document | 100 | 0 | 13 |
| TASK5-Add document to project | 88 | 14 | 0 |
| egas (9 curators) | |||
| TASK1-Log in and access the project | 100 | 0 | 0 |
| TASK2-Find project status (private vs public) | 89 | 0 | 13 |
| TASK3-Finding help | 100 | 0 | 0 |
| TASK4-Edit annotation | 100 | 0 | 0 |
| TASK5-Export and opening file | 33 | 0 | 0 |
| EXTRACT (10 curators) | |||
| TASK1-Install bookmarklet | 100 | 0 | 0 |
| TASK2-Extract on a piece of text | 100 | 0 | 0 |
| TASK3-Review annotations and information | 90 | 0 | 0 |
| TASK4-Save Extract table | 100 | n/a | n/a |
| TASK5-Finding help | 100 | 0 | 0 |
| GenDisFinder (9 curators) | |||
| TASK1-Find information on format | 100 | 0 | 0 |
| TASK2-Find GenDisFinder gene-disease associations in a given abstract | 33 | 0 | 0 |
| TASK3-Understand annotations and network | 33 | 0 | 0 |
| TASK4-Edit annotation | 56 | 20 | 20 |
| TASK5-Export annotation | 67 | n/a | n/a |
| MetastasisWay (11 curators) | |||
| TASK1-Register and install MAT | 82 | 33 | 22 |
| TASK2-Find information about vocabularies used* | 89 | 13 | 50 |
| TASK3-Review and edit annotations* | 67 | 17 | 17 |
| TASK4-Save annotation* | 89 | n/a | n/a |
| *calculations based on the 9 curators who were able to install the application | |||
| Ontogene (10 curators) | |||
| TASK1-Open a document in Ontogene | 100 | 10 | 0 |
| TASK2-Find information about panels | 100 | 10 | 0 |
| TASK3-Using filters in panels | 100 | 0 | 0 |
| TASK4-Validate annotation | 80 | 0 | 0 |
| TASK5-Export annotations | 100 | 0 | 0 |
For each system, a series of tasks were presented to the biocurators via the SurveyMonkey interface followed by questions to address task completion, difficulty of the task and confidence on the task. Based on the responses we calculated the percentage (%) of users that completed each task; the percentage that found the task difficult even when they were able to finish it; and the percentage who felt not-confident about their task performance. n/a means not applicable, that is we did not ask the question for that particular task.
The results collected from overall assessment of each system are shown in Figure 2. Many of the systems show a high proportion of skipped answers in the error message category, indicating that the user did not encounter any error messages along the way.
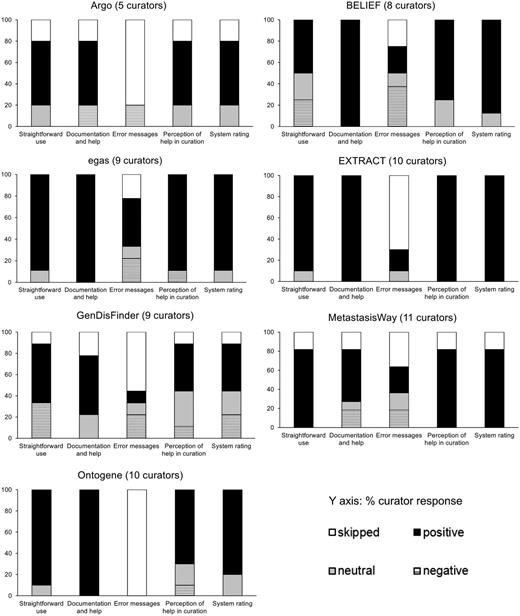
Pooled responses to questions related to system perception of usability from the pre-designed task activity.
We investigated correlation of the perception of system usefulness in the biocuration task with the system rating by calculating the correlation between the collective responses for each of these questions. The result shows that there is a weak positive correlation between the perception of the system usefulness in the biocuration task and the rating of the system (Spearman’s R = 0.3996 and two-sided P = 0.0023; Kendall tau = 0.3614, two-sided P = 0.0227), suggesting that the users would be more likely to rate the system higher if he/she perceives that the system would assist in the biocuration task.
The Net Promoter Scores (NPS) is a common metric used to measure customer loyalty in response to the question about likelihood of recommending the system to a colleague/friend. The NPS value widely varies across systems (bars in Figure 3), only three systems received positive NPS value (users would recommend system to a colleague). However, when we compare the Net Promoter Scores (bars in Figure 3) with the median of the system rating (black dots in Figure 3), we do not find a consistent trend (Figure 3). Although all systems have positive median ratings, they are not always accompanied by their recommendation to others. Reasons for this varied, e.g. biocurators did not see an immediate use for the curated data in their curation group or perceive difficulty in integrating TM tools into already established curation pipelines. Based on the interaction with the biocurators that participated in the task and the discussion during the BioCreative V Panel 1 on text mining applications, the latter reason has come up as a real bottleneck. The integration of the TM tools in the curation pipeline in well-established and mature databases might be difficult to achieve. The best opportunities exist in small and/or newly established databases. Therefore, TM developers should consider interaction with biocuration groups at an early stage of database development. Alternatively, effective ways to consume the TM data in ways that do not significantly interfere with the established database pipelines need to be developed, such as web-based TM services (26).
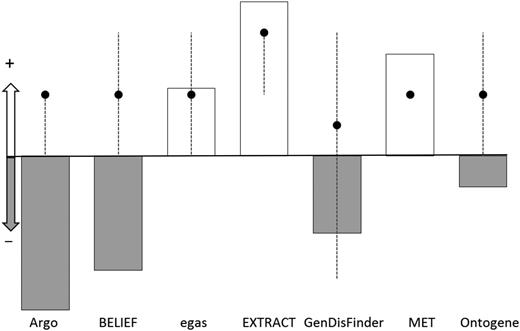
Plot of the NPS score (bars) and the median for the system rating for each system (dots). The y-axis represents whether the NPS and median are positive (for NPS, positive means NPS > 0, for system rating median >3) or negative (for NPS, negative means NPS < 0, for system rating median <3). The NPS score is represented with bars, white and grey color indicate positive and negative scores, respectively. The median for the system rating is represented with black dots with dotted line extending from minimum to maximum value for the sample.
Full curation task
In the full curation task, some teams reported equal or slight improvement of throughput with the system over the manual task. One system reported important differences between novice and expert users. Another system reported lower throughput using the tool, due to differences in level on annotation between manual and system-assisted (in the latter the user needs to check all mention and normalization results). One system reported >10 times the throughput using the TM system (Table 10). It is worth noting that this system was exclusively tested by curators from one database working closely with the developer throughout the task. The results from the SUS score (Figure 4) shows that most of the systems scored around average. In one case, a system showed lower than average SUS score but average learnability score, pointing to issues specifically in the usability of the system. In another case, a high variability in learnability across users was observed, and this was the case for novice versus experienced curators of BEL expressions. Finally, the system that consistently rated with high SUS score (including learnability and usability) was the one closely working with the curators.
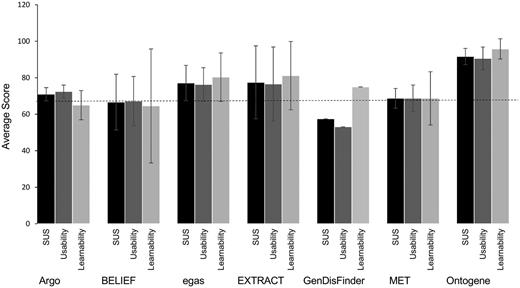
Scores for usability and learnability for each system. SUS score (black) encompasses 10 standard questions, question 4 and 10 are related to learnability (light grey) where the others to usability (dark grey). Standard deviations are shown. The dashed line indicates the average SUS 68.
Ontogene metrics from full level evaluation
| Performance | |||||||||
|---|---|---|---|---|---|---|---|---|---|
| Curators | Annotation | Non-TM assisted | TM assisted | ||||||
| 3 | #articles/day | 1 | 12 | ||||||
| Survey | median | Q1 | min | max | Q3 | Ave. | St. Dev | ||
| Task | 4 | 3 | 3 | 5 | 5 | SUS | 91.67 | 4.44 | |
| Design | 4 | 3.75 | 3 | 5 | 4.25 | Usability | 90.62 | 6.25 | |
| Usability | 3 | 3 | 3 | 4 | 4 | Learnability | 95.83 | 5.55 | |
The upper half of the table shows the number of curators involved in the evaluation, and the throughput (average time per article or per concept annotated) without or with the assistance of TM. The lower half of the table shows the central tendency of the survey results for the pool of questions related to ability to complete the task (Task), Design of the interface (Design) and Usability. The responses were converted to a numeric scale from 1 (most negative response) to 5 (most positive response). To give an idea of the response distribution, the central tendency is described with the median along with minimum (min) and maximum (max) values, respectively, and the lower (Q1) and upper (Q3) quartiles, respectively. In addition, the average system usability score (SUS) from the SUS questionnaire and its breakdown into the usability (all questions but 4 and 10) and learnability (questions 4 and 10) questions are shown on the lower right. A score higher than 68 means the system scored better than average (other benchmarked systems).
Full curation task by system
Argo (URL: http://argo.nactem.ac.uk, Team 277: Batista-Navarro, Carter, and Ananiadou)
Description: Argo is a generic TM workbench that can cater to a variety of use cases, including the semiautomatic curation of information from literature. It enables its technical users to build their own customized TM solutions by providing a wide array of interoperable and configurable elementary components that can be seamlessly integrated into processing workflows. With Argo’s graphical annotation interface, domain experts can then make use of the workflows’ automatically generated output to curate information of interest.
Task: Five domain experts utilized Argo for the curation of phenotypes relevant to Chronic Obstructive Pulmonary Disease (COPD). Specifically, they carried out three curation subtasks: (1) the markup of phenotypic mentions in text, e.g. medical conditions, signs or symptoms, drugs and proteins, (2) linking of mentions to relevant vocabularies/ontologies, i.e. normalization and (3) annotation of relations between COPD and other mentions.
Corpus: 30 COPD-relevant PubMed Central Open Access papers were chosen, which had been annotated as part of previous work (27). The corpus was split into two subsets with 15 papers each: one for training the TM tools underpinning the semiautomatic COPD phenotype curation workflow, and another from which the documents for curation were drawn. Since the time constraints did not make the annotation of entire full-text papers feasible, we defined a document as a smaller chunk of text (e.g. section paragraphs according to each paper’s metadata). Based on automatic random selection, 124 such documents were set aside for the curation task. The first 62 were used for purely manual curation while the remaining were exploited in the TM-assisted mode of the task. All of the biocurators worked on the same data set.
Results: Results from the performance and survey are summarized in Table 4. Using the concept annotations (e.g. text span boundaries and semantic types) of the expert who voluntarily curated all of the 124 documents in the data set, we evaluated the performance of the Argo workflow, which formed the basis of the TM support provided to the biocurators. The overall micro-averaged precision, recall and F score values are 68.17, 63.96 and 66.97, respectively. These results are quite encouraging, considering that the F-score (66.97) is very close to the measured IAA (68.12), indicating that the automatic concept annotation workflow performs comparably with human curators. The usability score is just slightly higher than the average; the learning component seems to have the highest variability.
Argo metrics from full level evaluation
| Performance | Ave. # documents/hour | |||||||||
|---|---|---|---|---|---|---|---|---|---|---|
| Curators | Annotation | non-TM assisted | TM assisted | Ave. IAA | ||||||
| 5 | concept | 9 | 14 | 68.12% | ||||||
| relation | 25 | 35 | ||||||||
| Survey | median | Q1 | min | max | Q3 | Ave. | St. Dev. | |||
| Task | 4 | 4 | 2 | 5 | 4.5 | SUS | 71 | 3.6 | ||
| Design | 3 | 3 | 2 | 4 | 4 | Usability | 72.5 | 3.5 | ||
| Usability | 4 | 3 | 2 | 5 | 4 | Learnability | 65 | 8 | ||
The upper half of the table shows the number of curators involved in the evaluation, the throughput (average number (#) of curated documents per hour) without or with the assistance of TM, and the average inter-annotator agreement (IAA). The lower half of the table shows the central tendency of the survey results for the pool of questions related to ability to complete the task (Task), Design of the interface (Design) and Usability. The responses were converted to a numeric scale from 1 (most negative response) to 5 (most positive response). To give an idea of the response distribution, the central tendency is described with the median along with minimum (min) and maximum (max) values, respectively, and the lower (Q1) and upper (Q3) quartiles, respectively. In addition, the average system usability score (SUS) from the SUS questionnaire and its breakdown into the usability (all questions except 4 and 10) and learnability (questions 4 and 10) questions are shown on the lower right. A score higher than 68 means the system scored better than average (other benchmarked systems).
System comparison to BioCreative IV: Argo offers high flexibility and customization of annotation workflows. In BioCreative IV, the user was asked to build the TM workflow to facilitate the curation of metabolic process-related concepts (20). However, this was a real bottleneck to the biocurators, as they were not familiar with all the different TM modules and file formats. In BioCreative V, the user was presented with the text mined results with a pre-built workflow. In addition, the ability to view or edit already saved manual annotations was included. These features seem to have improved the usability of the system for the biocurators.
BELIEF (URL: http://belief.scai.fraunhofer.de/Belief Dashboard/, Team 333: Madan, Hodapp and Fluck)
Description: BELIEF (Biological Expression Language Information Extraction Workflow) is a semi-automated curation interface that supports an expert in relation extraction and encoding in the modeling language BEL. BEL can represent biological knowledge in causal and correlative relationships that are triples. A triple consists of a subject, a predicate (relationship) and an object. The relations are spanning from molecular relationships between proteins or chemical entities to relationships with biological processes or diseases.
Corpus: 20 PubMed abstracts were chosen for the curation task. The documents were selected from different areas with different entities, but consistent with the context for which BELIEF was created. All users worked with the same set of data divided into two sets (Set1 and Set2), containing 10 documents each.
Results: There were two distinct groups of users: those who had previous experience with BEL coding and those who were new to both BEL and the annotation interface. Annotators in the first group had a higher throughput per hour (approximately 5 documents) than the novice (1–2 documents). As mentioned before, we provided 10 documents each for the two curation tasks (TM-assisted and non-TM-assisted curation) to each annotator. Due to time constraints, most of the annotators curated less than ten documents for each of the tasks. Overall 25 documents were curated in 392 min with the BELIEF Dashboard. The manual curation produced in total 24 documents in 374 min out of which eight documents (33.3%) are syntactically invalid containing various syntax errors. The tool does not seem to speed up curation of BEL statements significantly when compare to non-TM assisted, but this could be due to the learning curve for the BEL language and the interface, and the low number of documents that were therefore annotated. However, given the percentage of error in the non-TM assisted task, additional effort and time was needed to correct invalid documents in a post-processing step. In contrast, assisted curation does not need such a step, as BELIEF syntax validator helps the curator to detect and eliminate errors during the curation process. The final survey shows that the learnability, as computed based on the SUS questionnaire, gives the lowest score with the highest variability, which depends on the user experience (Table 5). This is in agreement with the results shown for the pre-designed tasks. It should also be mentioned that the task had the highest complexity— extraction of complex relationships between different entity classes as well as to understand and acquire the BEL syntax.
egas (URL: https://demo.bmd-software.com/egas/, Team 286: Matos, Campos, Pinho, Silva, Mort, Cooper, and Oliveira)
BELIEF metrics from full level evaluation
| Performance | Ave. # documents/hour* | |||||||
|---|---|---|---|---|---|---|---|---|
| Curators | Non-TM assisted | TM assisted | ||||||
| 6 | 4 | 4 | ||||||
| Survey | median | Q1 | min | max | Q3 | Ave. | St. Dev. | |
| Task | 4 | 3 | 2 | 5 | 4 | SUS | 66.67 | 15.28 |
| Design | 3.5 | 3 | 2 | 5 | 4 | Usability | 67.19 | 13.54 |
| Usability | 3 | 3 | 2 | 4 | 4 | Learnability | 64.58 | 31.25 |
The number of documents per hour was rounded up.
The upper half of the table shows the number of curators involved in the evaluation, and the throughput (average time per article or per concept annotated) without or with the assistance of TM. The lower half of the table shows the central tendency of the survey results for the pool of questions related to ability to complete the task (Task), Design of the interface (Design) and Usability. The responses were converted to a numeric scale from 1 (most negative response) to 5 (most positive response). To give an idea of the response distribution, the central tendency is described with the median along with minimum (min) and maximum (max) values, respectively, and the lower (Q1) and upper (Q3) quartiles, respectively. In addition, the average system usability score (SUS) from the SUS questionnaire and its breakdown into the usability (all questions but 4 and 10) and learnability (questions 4 and 10) questions are shown on the lower right. A score higher than 68 means the system scored better than average (other benchmarked systems).
Description: Egas is a web-based platform for TM-assisted literature curation, supporting the annotation and normalization of concept mentions and relations between concepts. Egas allows the definition of different curation projects with specific configuration in terms of the concepts and relations of interest for a given annotation task, as well as the ontologies used for normalizing each concept type. Egas may be described as an ‘annotation-as-a-service’ platform. Document collections, users, configurations, annotations and back-end data storage, are all managed centrally, as are the tools for document processing and TM. This way, a curation team can use the service, configured according to the annotation guidelines, to take advantage of a centrally managed pipeline.
Task: This task was identification of human, inherited gene mutations and associated clinical attributes, such as inheritance mode and penetrance, described in PubMed abstracts. Seven curators were selected and were asked to annotate documents that were pre-analyzed by an automatic concept recognition tool (half of the corpus), and raw documents (the remaining corpus), in order to evaluate the added benefit of TM-assisted curation. Three curators annotated the complete corpus, two curators followed a 4 h time-limited work plan, and the other two curators annotated a small portion of the corpus (13 and 9 documents).
Corpus: A classifier, trained using articles previously selected as relevant for the Human Gene Mutation Database (HGMD) (28), was used to prioritize the results from a PubMed query (about 28 000 articles). Then the top 100 articles were selected for the annotation task.
Results: In general, it took a shorter time to curate documents that had been previously annotated by the concept recognition tool, although the results are not conclusive (Table 6). The inter-annotator agreement is acceptable for this task. In terms of perception metrics, the usability SUS score is above average for this system, and consistently rated positively in all aspects evaluated.
Egas metrics from full level evaluation
| Performance | ||||||||
|---|---|---|---|---|---|---|---|---|
| Curators* | Annotation | Non-TM assisted | TM assisted | Ave. IAA | ||||
| 7 | concept | 664 | 744 | 74% | ||||
| relation | 157 | 217 | ||||||
| time/article (seconds) | 245 | 219 | P-value 0.25 | |||||
| time/concept (seconds) | 13.1 | 10.8 | P-value 0.17 | |||||
| Survey | median | Q1 | min | max | Q3 | Ave. | St. Dev. | |
| Task | 4 | 4 | 3 | 5 | 5 | SUS | 77.14 | 9.69 |
| Design | 4 | 4 | 3 | 5 | 5 | Usability | 76.34 | 9.18 |
| Usability | 4 | 3 | 3 | 5 | 4 | Learnability | 80.36 | 13.26 |
7 curators participated in the full activity: two curators annotated a small portion of the corpus (8–13 documents), hence their annotation was not included in annotation metrics, but were included in the survey.
The upper half of the table shows the number of curators involved in the evaluation, the throughput (average time per article or per concept annotated) without or with the assistance of TM, and the average inter-annotator agreement (IAA). The lower half of the table shows the scores for the survey results for the pool of questions related to ability to complete the task (Task), Design of the interface (Design) and Usability. The scale was from 1 to 5 from most negative to most positive response, respectively. To give an idea of the response distribution, the scores are shown as median with minimum (min) and maximum (max) values, respectively, and the lower (Q1) and upper (Q3) quartiles, respectively. The average system usability score (SUS) from the SUS questionnaire and its breakdown into the usability (all questions but 4 and 10) and learnability (questions 4 and 10) questions.
System comparison to BioCreative IV: Egas also participated in BioCreative IV, for a different task, assisting in the identification of protein-protein interactions described in PubMed abstracts related to neuropathological disorders (23). When evaluated by biocurators, it obtained positive scores in terms of usability, reliability and performance. Some of enhancements from previous version include offering more output formats, and inclusion of a variety of knowledgebase and ontologies for normalization.
EXTRACT (URL: https://extract.hcmr.gr, Team 327: Pafilis, Buttigieg, Schnetzer, Arvanitidis, and Jensen)
Description: EXTRACT is an interactive annotation tool that helps curators, during browsing, to identify and extract standard-compliant terms for the annotation of the source environment of metagenomics and other sample records (17). Behind the web-based user interface, the system combines components from published systems for Named Entity Recognition (NER) of environments, organisms, tissues and diseases.
Task: The two full evaluators were asked to investigate if the EXTRACT bookmarklet can help them locate sampling environment information in a document and if it can accelerate the metagenomics record metadata annotation process. In particular, they were asked to annotate samples as recommended by the standards. Annotated metadata included filling in the ‘environmental feature, environmental material and biome’ describing a sample’s source environment. The evaluators performed this task with and without the assistance of EXTRACT and compared the time taken in both cases. The goal was to assess the curation acceleration that EXTRACT offers when evaluators work as closely as possible to their actual workflow.
Corpus: The full evaluators were asked to try EXTRACT with records they would annotate as part of their normal curation tasks. In response to this, each evaluator curated eight multiple metagenomics record-related, full-text articles.
Results: Comparison of fully manual and TM-assisted curation revealed that EXTRACT speeds up annotation by 15–25% and helps curators detect terms that would otherwise have been missed. The quality of the tagging results for species and environments has previously been evaluated on gold-standard corpora consisting of Medline abstracts and of Encyclopedia of Life species summary pages, respectively (29, 30). Counted at the level of individual mentions, the SPECIES and ENVIRONMENTS taggers showed precision of 83.9 and 87.8%, recall of 72.6 and 77.0%, and F1 scores of 78.8 and 82.0%, respectively. The quality of the NER of tissues and diseases has not been benchmarked directly; however, these NER components have shown to give good results when used for co-mentioning-based extraction of protein–tissue and protein–disease associations (31, 32). In terms of perception metrics, the evaluators generally found the system to be intuitive, useful, well documented and sufficiently accurate to be helpful in spotting relevant text passages and extracting organism and environment terms (Figure 3 and Table 7). The SUS score is above average but with high variability as it is the result of two users using EXTRACT in their own different curation pipelines.
EXTRACT metrics from full level evaluation
| Survey | median | Q1 | min | max | Q3 | Ave. | St. Dev. | |
|---|---|---|---|---|---|---|---|---|
| Task | 4 | 3.25 | 1 | 4 | 4 | SUS | 77.5 | 20.0 |
| Design | 4.25 | 3.75 | 2 | 5 | 5 | Usability | 76.6 | 20.3 |
| Usability | 4 | 4 | 4 | 4 | 5 | Learnability | 81.2 | 18.7 |
| Survey | median | Q1 | min | max | Q3 | Ave. | St. Dev. | |
|---|---|---|---|---|---|---|---|---|
| Task | 4 | 3.25 | 1 | 4 | 4 | SUS | 77.5 | 20.0 |
| Design | 4.25 | 3.75 | 2 | 5 | 5 | Usability | 76.6 | 20.3 |
| Usability | 4 | 4 | 4 | 4 | 5 | Learnability | 81.2 | 18.7 |
The table shows the central tendency of the survey results for the pool of questions related to ability to complete the task (Task), Design of the interface (Design) and Usability. The responses were converted to a numeric scale from 1 (most negative response) to 5 (most positive response). To give an idea of the response distribution, the central tendency is described with the median along with minimum (min) and maximum (max) values, respectively, and the lower (Q1) and upper (Q3) quartiles, respectively. In addition, the average system usability score (SUS) from the SUS questionnaire and its breakdown into the usability (all questions but 4 and 10) and learnability (questions 4 and 10) questions are shown on the lower right. A score higher than 68 means the system scored better than average (other benchmarked systems).
GenDisFinder (URL: http://biominingbu.org/GenDis Finder, Team 294: Subramani and Natarajan)
Description: GenDisFinder is a web-based TM tool that aids in the extraction of known/novel/inferred human gene–disease associations from biomedical literature and further categorizes them using networks analysis. GenDisFinder has four different modules for the above tasks: (1) gene mention and normalization of gene/protein names with NAGGNER and ProNormz (33), respectively, (2) disease mention identification and normalization using OMIM-based normalized disease phenotype dictionary, (3) identification and extraction of semantic relations between genes and diseases using a relation keyword dictionary and (4) construction of gene–disease association networks and further categorization. To the best of our knowledge, GenDisFinder is the first tool that integrates TM with network analysis to discover novel genes associated with a disease and provides an interface to view the interaction network.
Task: Curate a set of abstracts for gene-disease association. Curate genes, disease and gene–disease association relations. Also, validate the categorization of the abstract into novel, unknown or known gene–disease associations.
Corpus: This is an in-house, curated, gene–disease association corpus called the Human Gene-Disease Association (HGDA) corpus, which is available on-line from the website. From the GeneRIF database a randomly selected set of 500 sentences were manually annotated with gene name, disease name relation type and gene-disease association information by three domain experts. This defined the HGDA corpus for our TM methodology evaluation. The HGDA corpus contains PubMed ID, corresponding sentences, HGNC approved gene entries, OMIM phenotype-based disease entries and relation types such as genetic variation, altered expression, regulatory modification, negative association or ‘any’. The final HGDA corpus contains 157 unique genes, 96 unique diseases and 206 relations from 182 sentences.
Results: Note that only one curator participated in the full annotation task. Based on this unique user, the SUS score is lower than the average 68, and it seems to be mostly related to usability aspects, as learnability item had a score of 75. Other questions related to usability and help in task completion were mostly neutral (value 3) (Table 8). Based on the user feedback, the categories were renamed/redefined to align with user’s understanding.
GenDisFinder metrics from full level evaluation
| Survey | median | Q1 | min | max | Q3 | Ave. | St. Dev | |
|---|---|---|---|---|---|---|---|---|
| Task | 3 | 3 | 3 | 3 | 3 | SUS | 57.50 | n/a |
| Design | 3.5 | 3 | 3 | 4 | 4 | Usability | 53.12 | n/a |
| Usability | 3 | 3 | 3 | 3 | 3 | Learnability | 75.00 | n/a |
| Survey | median | Q1 | min | max | Q3 | Ave. | St. Dev | |
|---|---|---|---|---|---|---|---|---|
| Task | 3 | 3 | 3 | 3 | 3 | SUS | 57.50 | n/a |
| Design | 3.5 | 3 | 3 | 4 | 4 | Usability | 53.12 | n/a |
| Usability | 3 | 3 | 3 | 3 | 3 | Learnability | 75.00 | n/a |
The table shows the central tendency of the survey results for the pool of questions related to ability to complete the task (Task), Design of the interface (Design) and Usability. The responses were converted to a numeric scale from 1 (most negative response) to 5 (most positive response). To give an idea of the response distribution, the central tendency is described with the median along with minimum (min) and maximum (max) values, respectively, and the lower (Q1) and upper (Q3) quartiles, respectively. In addition, the average system usability score (SUS) from the SUS questionnaire and its breakdown into the usability (all questions but 4 and 10) and learnability (questions 4 and 10) questions are shown on the lower right. A score higher than 68 means the system scored better than average (other benchmarked systems).
MetastasisWay (MET, URL: http://btm.tmu.edu.tw/metastasisway, Team 311: Dai, Su, Lai, Chang and Hsu)
Description: This is a curation tool developed as a Chrome browser extension which allows curators to review and edit concepts and relations related to metastasis directly in PubMed. PubMed users can view the metastatic pathways integrated from the large collection of research papers. The TM services support a wide range of biomedical concepts including gene, microRNA, neoplasm metastasis, cytoskeleton, cell movement, cell adhesion, neoplasms, tissues and organs. Based on the recognized concepts, the relations among them are determined and sent for visualization in the client-side browser.
Task: The task was to annotate abstracts with the nine biomedical concepts related to metastasis described above and also any relation within or between those concepts of the type positive regulation, negative regulation or neutral regulation.
Corpus: To collect a set of articles related to metastasis and its regulation, we searched PubMed with the query term ‘EMT[title/abstract] AND TGF-β[title/abstract]’ (Note: EMT is epithelial-to-mesenchymal transdifferentiation). From the result, 300 abstracts were randomly selected as the curation dataset for the interactive TM task. The data was split among six curators who participated in the task with overlapping sets.
Results: The annotation throughput of the non-TM-assisted task (but using BRAT, http://brat.nlplab.org/standoff.html) versus the TM-assisted task is slightly higher for the non-TM-assisted (Table 9). This unexpected result could be due to differences of extent of annotation (MetastasisWay annotates all bioconcept mentions and relations along with links to identifiers, whereas, in manual mode the user concentrated only on the sentences containing the relations, and in some cases, they did not normalize the annotated concepts). Despite the results above, the perception of usability measures are overall positive for this system with SUS score within the average range, consistent with results from the pre-designed task.
MetastasisWay metrics from full level evaluation
| Performance | |||||||||
|---|---|---|---|---|---|---|---|---|---|
| Curators | Annotation | Non-TM assisted | TM assisted | ||||||
| 6 | #abstracts Week1 | 46 | 40 | ||||||
| #abstracts Week2 | 49 | 44 | |||||||
| Survey | median | Q1 | min | max | Q3 | Ave. | St. Dev | ||
| Task | 4 | 3.25 | 1 | 5 | 4 | SUS | 68.75 | 5.41 | |
| Design | 4 | 4 | 3 | 5 | 5 | Usability | 68.75 | 7.29 | |
| Usability | 4 | 3 | 2 | 5 | 4 | Learnability | 68.75 | 14.58 | |
The upper half of the table shows the number of curators involved in the evaluation, the throughput (number (#) of abstracts annotated per week) without or with the assistance of TM. The lower half of the table shows the central tendency of the survey results for the pool of questions related to ability to complete the task (Task), Design of the interface (Design) and Usability. The responses were converted to a numeric scale from 1 (most negative response) to 5 (most positive response). To give an idea of the response distribution, the central tendency is described with the median along with minimum (min) and maximum (max) values, respectively, and the lower (Q1) and upper (Q3) quartiles, respectively. In addition, the average system usability score (SUS) from the SUS questionnaire and its breakdown into the usability (all questions but 4 and 10) and learnability (questions 4 and 10) questions are shown on the lower right. A score higher than 68 means the system scored better than average (other benchmarked systems).
Ontogene (18) (URL: http://www.ontogene.org, Team 364: Balderas-Martinez, Rinaldi, Contreras, Solano, Sanchez-Perez, Gama-Castro, Collado-Vides, Selman and Pardo)
Description: Ontogene is a platform for the curation of bioconcepts, such as miRNA, gene, disease, chemical and their relations.
Task: Use the OntoGene TM pipeline and the ODIN curation system to curate miRNAs in relation to one particular respiratory disease, idiopathic pulmonary fibrosis, from full length articles. Annotate miRNA names, target genes, transcription factors associated, organisms, diseases, levels of miRNA and some characteristics of the sample.
Corpus: For the miRNA corpus the articles were selected by PubMed search with the query: idiopathic pulmonary fibrosis AND microRNA. The final corpus contained 62 articles.
Results: Note that this system was specifically tailored for the RegulonDB (34) curation pipeline, and was tested at the full level by RegulonDB curators. The results are very positive, the throughput of articles curated using Ontogene platform is much higher than the non-TM assisted mode. Also, the SUS score and other subjective measures are quite high for this system (Table 10). This shows that the integration of Ontogene in the curation pipeline has been successful.
System comparison to BioCreative IV: Ontogene also participated in BioCreative IV for a different task, assisting in the detection of Gene/Chemical/Diseases and their interactions in abstracts. The system used vocabularies and standard from the Comparative Toxicogenomics Database (CTD), in alignment with a parallel track (35). In BioCreative V the task was performed with full-length articles in collaboration with curators of RegulonDB. The close collaboration between the team and the database seems to be a key factor for very positive overall impression on this system.
General observations
One of the important aspects of the interactive activity is that it exposes the systems to a reality check. We looked, for example, at the standards the systems offer for annotation (Table 2) and asked the set of curators who participated in the full task which standards they use or intend to use in their work. The results are presented in Figure 5. The table on the left side lists the bioentity types and standards used with the bar graph on the right side depicts the number of curators using such standard. It is very positive to see that the standards implemented by the systems are indeed used by the community. The most voted vocabularies were the ones for taxonomy, disease/phenotype and gene/protein. As previously mentioned, gene–disease/phenotype was a common theme among the systems, and therefore the pool of curators recruited for this domain was over-represented. In addition, the number of vocabularies for disease/phenotype used among systems was more diverse than other topics, with Disease Ontology and MeSH terms being the top ones used by the users who participated in the survey. This reflects the reality that disease/phenotype concepts are represented in numerous medical vocabularies and the expansion of sub-types has been driven by the data needs of the user community (36).
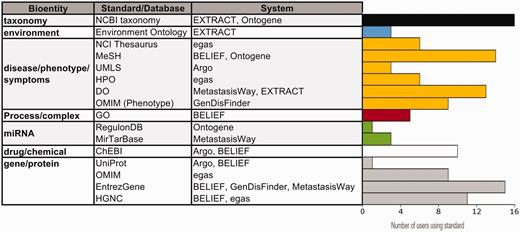
Usage of standards/databases proposed by the systems. The table describes most of the bioentities and standards/databases proposed by the different systems, and the bar graphs show the number of IAT evaluators using each standard/database. Note that environment is a specialized bioentity type which is only used by the microbial and metagenomics communities. Data from 25 users.
The complexity of the curation tasks differed considerably among the systems, the highest complexity was within the BELIEF system, where the user has to code in a certain modeling syntax (BEL). Interestingly, we found that given this complex task the system can actually help the curator to suggest or check the correct BEL syntax for the expression (the performance using the system was higher than the non-TM assisted).
In a few cases, the evaluation revealed important differences in the way the user and the system approach the curation. In one case, the biocuration task asked curators to curate all the mentions extensively, including relations and normalization proposed by the system, whereas in reality the users would only be interested in curating the subset that is most relevant to them. In another case, the task included categorizing gene–disease associations into known, novel and unknown. However, the definitions of novel and unknown as defined by the system were not intuitive to the users. The term ‘novel’ was used by the system to indicate that the association of the gene to a disease was based on the association network, while for the user this would be an inference, not a novelty. Whereas the term ‘unknown’ was used for gene-disease relations found in the text that are not yet in the system, which for the user would be a novelty (experimental evidence of association).
Overall users had a satisfactory experience with the system(s) they tested, and in terms of performance and usability measures, a few systems have been consistent throughout the evaluation and seem to have promising potential for wider adoption. It is worth noting that this was mostly the case for the teams that worked very closely with the users. We should also highlight that the system tackling the metagenomics needs has been tested in the context of different biocuration pipelines, and although an extensive evaluation could not be done, it seems that it is a promising tool, not only to the two curators but to the 10 additional users who tried it during the partial task.
BioCreative has served a catalyst of interactions between the NLP and the biocuration community since 2010. As a result, the systems participating repeatedly in the BioCreative IAT task (e.g. Argo and Ontogene) have improved their performance over time. In addition, in the annual International Society for Biocuration (ISB) meetings, the subject of TM for biocuration has moved from isolated talks within ‘Literature collection & curation’ session (ISB 2008–2010) to its own session/workshops ‘Text/literature Mining’ (ISB 2011–2016). The biocuration community is now very actively exploring and evaluating tools, especially for the need of scaling up curation (37). Moving forward the interactive task will work on refining and documenting the metrics for assessing interactive systems, and exploring TM use in several other real-word and large-scale applications beyond database curation. The panel discussion in BioCreative V on TM applications highlighted needs of TM in several areas that can have an interactive component, and which are at a nascent stage of development. Finally, we have asked both the teams and the users about the experience in participating in the IAT activity. Both groups find participation a positive and rewarding experience overall.
Acknowledgements
We would like to acknowledge all the users and team members who have participated in this activity throughout BioCreative.
Funding
National Institutes of Health [R13GM109648 to C.N.A., P41HG003751 and U54GM114833 to K.R. and M.M.]; Intramural Research Program at National Library of Medicine to Z.L.]; National Institutes of Health Office of Director [R24OD011883 to N.V.]; the US Department of Energy [DE-SC0010838 to C.H.W. and L.H.]; National Science Foundation [#1340112 to L.C., DBI#1356374 for B.F.]; Ontario Research Fund; the European Molecular Biology Laboratory; Facultad de Ciencias, UNAM; the post-doctoral program fellowship from DGAPA-UNAM to Y.I.B.-M.
Conflict of interest. None declared.
References
Author notes
Citation details: Wang,Q., Abdul,S.S., Almeida,L., et al. Overview of the interactive task in BioCreative V. Database (2016) Vol. 2016: article ID baw119; doi:10.1093/database/baw119.
