


Abstract
As ecosystem engineers, seagrasses are angiosperms of paramount ecological importance in shallow shoreline habitats around the globe. Furthermore, the ancestors of independent seagrass lineages have secondarily returned into the sea in separate, independent evolutionary events. Thus, understanding the molecular adaptation of this clade not only makes significant contributions to the field of ecology, but also to principles of parallel evolution as well. With the use of Dr. Zompo, the first interactive seagrass sequence database presented here, new insights into the molecular adaptation of marine environments can be inferred. The database is based on a total of 14 597 ESTs obtained from two seagrass species, Zostera marina and Posidonia oceanica, which have been processed, assembled and comprehensively annotated. Dr. Zompo provides experimentalists with a broad foundation to build experiments and consider challenges associated with the investigation of this class of non-domesticated monocotyledon systems. Our database, based on the Ruby on Rails framework, is rich in features including the retrieval of experimentally determined heat-responsive transcripts, mining for molecular markers (SSRs and SNPs), and weighted key word searches that allow access to annotation gathered on several levels including Pfam domains, GeneOntology and KEGG pathways. Well established plant genome sites such as The Arabidopsis Information Resource (TAIR) and the Rice Genome Annotation Project are interfaced by Dr. Zompo. With this project, we have initialized a valuable resource for plant biologists in general and the seagrass community in particular. The database is expected to grow together with more data to come in the near future, particularly with the recent initiation of the Zostera genome sequencing project.
The Dr. Zompo database is available at http://drzompo.uni-muenster.de/
Introduction
Seagrasses are underwater flowering plants (angiosperms) belonging to the order Alismatales comprising of about 60 species (Supplementary Figure 1). Around the globe, seagrasses occupy shallow sedimentary shorelines where they operate as ecosystem engineers (1,2), and are ranked among the most valuable ecosystems on earth, surpassing the economic values of coral reefs or even tropical rain forests (3). Unique ecosystem services rendered by seagrasses include nutrition retention, erosion control, animal nursery and carbon sequestration (1,4).
Ecosystems founded by and based on seagrasses are rich and valuable, but they are also fragile. In recent years, it has been reported that seagrass populations show significant decline as a result of rapid environmental and anthropogenic changes (1,5–8); these changes will become more pronounced as global warming perpetuates (9). Seagrasses are of particular interest, not only because they occupy an ecologically unique position, but also serve as an extraordinary study system for evolutionary biologists. During the Cretaceous period, ancestors of seagrasses have secondarily returned to the sea in at least three independent lineages (10), offering great opportunities for the study of adaptation to a marine habitat and principles of parallel evolution in general (11,12).
The most abundant seagrass on the northern hemisphere, Zostera marina L., has recently been selected for a pilot genome sequencing project at the Joint Genome Institute (http://www.jgi.doe.gov/). As the first non-domesticated monocotyledon, this species will be an important addition to the poorly represented monocot branch of angiosperms. Thus, Zostera marina will become a corner stone of marine molecular ecology research, with complementary data to follow from several other seagrass species such as Zostera noltii and Posidonia oceanica to conduct further comparative studies.
With the Zostera genome project under way and a large world-wide community working with seagrasses, it is imperative to provide a central data resource which is easily accessible by ecologists, evolutionary biologists and the like. In this context, we see our database as a nucleus for seagrass data that will be generated at ever increasing speed with the advent of next generation sequencing, aiming to serve the rapidly growing seagrass community.
Dr. Zompo is a first step in creating this valuable community resource while also simultaneously addressing insight into molecular evolution and adaptation. This database serves as a basis for a large-scale comparative analysis, a novel approach in contrast to earlier studies which have focused on single gene loci only (10,13–16). A total of 14 597 ESTs of two seagrass species, Z. marina and P. oceanica, were analyzed. Employing such comparative analyses help to gain insights into the question how independent seagrass lineages have adapted to putatively similar ecological conditions on the genetic level. Inferences can be made through results of shared orthologous genes between the two species that show significantly different expression levels, and Pfam-A protein domains whose abundance is significantly skewed towards one species.
Implementation and architecture
Dr. Zompo architecture consists of a relational database integrated in the Ruby on Rails (RoR) framework (http://www.rubyonrails.org/). RoR is an open source web application framework built on the Ruby programming language, intended for developing database-backed web applications according to the Model-View-Control pattern. Overall, the RoR framework provides ideal grounds for efficient development of user-friendly and attractive web applications. Our application operates under an Apache web server on a DEBIAN Linux system and integrates a MySQL database, Apache's Lucene search engine library, the BioRuby library, the statistical language R and NCBI BLAST.
Database content
Dr. Zompo was designed to store EST data and corresponding annotation of multiple seagrass species while supporting inter-species investigations (Figure 1). The framework is scalable, thus allowing to widen the scope of content to the flowering plant order Alismatales if desired, and is compatible with forthcoming genome data. The current release is based on 9412 Z. marina ESTs (17) and 5185 P. oceanica ESTs (18) which, after preprocessing, have been assembled into 3387 and 1219 tentative unigenes, respectively. The sequence length of EST reads within each library is summarized in Supplementary Table 1.
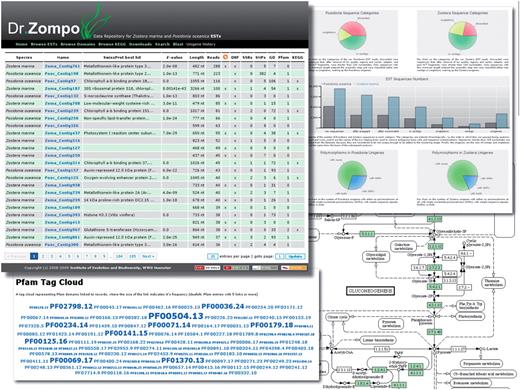
Dr. Zompo: screenshot of numerous ways to access the seagrass EST sequences and their annotation. Browse/Search results view, interactive flash charts of EST statistics, Pfam domain annotation represented as a tag cloud, KEGG pathway annotation with highlighted seagrass genes.
Posidonia EST libraries
Only one library was made from samples collected by SCUBA diving from a meadow located in Lacco Ameno, Ischia (Gulf of Naples). Total RNA, extracted from 10–15 genotypes from each of the two sampling depths (5 and 25 m), was isolated from pooled young leaf tissue and meristematic portions of shoots using a CTAB method. The cDNA was synthesized by vertis Biotechnologie AG, Freising, Germany. From about 11 000 000 recombinant clones, randomly selected clones from the library were isolated from plasmids (minipreps) and sequenced. Sequencing was performed both at the Stazione Zoologica Anton Dohrn (Naples, Italy) and at the Max Planck Institute of Molecular Genetics (Berlin, Germany).
Zostera EST libraries
Five different samples (experimental conditions and tissue types) were obtained from Schilksee and Maasholm (south-western Baltic Sea, Germany), from 1.6 to 2.5 m depth. Total RNA was extracted from young leaf tissue and meristematic region of plants. Two libraries represent natural conditions collected from average summer and winter conditions, respectively. Two other libraries were collected at the same sites, but under a heat stress treatment in aquaria at the water surface. The purpose of a fifth, redundant library was solely to improve the assembly. Each library contained the pooled RNA of 4–6 genotypes. Library construction was performed with Creator SMART cDNA library construction kit (Clontech) with directional ligation. Sequencing based on Plasmid preps was performed at Max-Planck-Institute for Limnology, Ploen, Germany.
EST sequence preprocessing, assembly, polymorphisms
In several preprocessing steps, using pregap4 from the Staden package (19) and cross_match from phrap (http://www.phrap.com/), the raw EST reads were processed to clip all uninformative sequence parts, including poor quality regions, vector and adapter fragments, and poly-A/-T tails. Remaining reads shorter than 100 nt were excluded from further processing. The resulting clean reads are publicly available on NCBI (P. oceanica accessions GO34959 to GO349047; Z. marina accessions AM268883 to AM268894, AM408830 to AM408843, AM766003 to AM773228, FC822029 to FC823188). For each species, separately, the clean reads were assembled into unigenes using CAP3 (20) with standard parameters and a minimum of one good read at clip position. We determined putative open reading frames (ORFs), microsatellites and single nucleotide polymorphisms for each of the resulting unigenes (Figure 2). Statistics and references to the tools employed for each of these steps are compiled in Table 1.
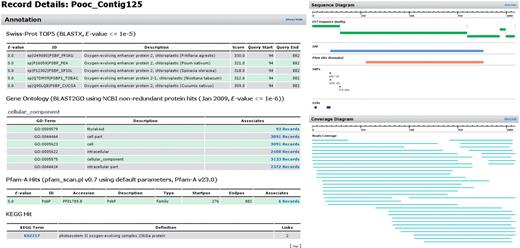
Dr. Zompo: extract from the detailed view of an exemplary contig. Large body of functional annotation (SwissProt, GeneOntology, Pfam, KEGG) plus visual representation of assembled reads and sequence properties (ORF, domains, polymorphisms).
Summarizing statistics on the EST sequence preprocessing steps and sequence analysis for both Zostera marina and Posidonia oceanica EST collections
| Z. marina | P. oceanica | |
|---|---|---|
| Number of raw EST sequences | 9412 | 5185 |
| Number of clean sequences after pregap4 | 7876 | 3089 |
| Number of clean sequences after crossmatch | 7416 | 3079 |
| Number of sequences in contigs after EST assembly | 5024 | 2238 |
| Number of singletons after EST assembly | 2392 | 841 |
| Number of contigs after EST assembly | 995 | 378 |
| Number of unigenes (contigs plus singletons) | 3387 | 1219 |
| Number of unigenes with a putative ORF | 3387 | 1219 |
| … based on homology to NCBI nr (BLASTX, E ≤ 1e−5) | 2467 | 963 |
| … without homology but longest polypeptide >20aa | 920 | 256 |
| Number of unigenes containing SSRs | 585 | 346 |
| Total number of SSRs | 730 | 498 |
| Number of unigenes containing potential SNPs | 115 | 18 |
| Total number of potential SNPs | 393 | 436 |
Putative ORFs were predicted based on homology to known proteins or by identifying the longest stretch of DNA that could be translated into more than 20 amino acids; potential SNPs were determined using QualitySNP (Tang,J., Vosman,B., Voorrips,R.E., van der Linden,C.G., and Leunissen,J.A.M. (2006) QualitySNP: a pipeline for detecting single nucleotide polymorphisms and insertions/deletions in EST data from diploid and polyploid species. BMC Bioinformatics, 7, 438), and SSRs were detected using SSRIT (Temnykh,S., DeClerck,G., Lukashova,A., Lipovich,L., Cartinhour,S. and McCouch,S. (2001) Computational and experimental analysis of microsatellites in rice (Oryza sativa L.): frequency, length variation, transposon associations, and genetic marker potential. Genome Res, 11, 1441–1452).
Unigene annotation
All seagrass unigenes were annotated comprehensively (Figure 2). This includes functional annotation on several levels (for annotation coverage see Supplementary Table 2): Seagrass unigenes were queried against (i) the manually curated, high quality SwissProt database (21) and (ii) the GeneOntology database (22) where annotation was assigned based on sequence similarity identified by BLAST with E-value ≤ 1e−5 (23). (iii) Protein domains were identified by comparing the seagrass sequences against hidden Markov models of the high quality Pfam-A domain database (24) using hmmpfam from the HMMER package (http://hmmer.janelia.org/). (iv) Within the unigene datasets, putative participants of molecular interactions and reaction networks were determined through KEGG [(25), KAAS, SBH method]. Moreover, we provide links to the corresponding entries on the main annotation websites: AmiGO, the official tool for searching and browsing the GeneOntology database, the Pfam website to show the summary entry, KEGG's orthology, hierarchy and pathway definitions.
Querying the database
The Dr. Zompo web application allows access to the unigenes from several different directions: (i) The complete set of unigenes can be browsed manually, listing almost all the associated properties and characterizations of each sequence in one table. (ii) Using BLAST (23), unigenes that show sequence similarity to any query sequence can be identified. In addition, BLAST queries can be performed against the genomic cDNA and peptide sequence databases of the two most important genetic plant model organisms, Arabidopsis thaliana and Oryza sativa, and the two genome projects are interfaced by directly linking all Arabidopsis and rice gene IDs to the respective resource. (iii) Search queries allow to find unigenes with certain properties (for instance presence of polymorphisms), and full-text searches scan all annotation descriptions and return a list of results scored by relevance. (iv) KEGG annotation is accessible either via a browsable list of all unigenes that have been identified to have a KEGG orthologue, or via the KEGG pathway maps where maps of interest can be viewed. In those maps, proteins that have been associated with one of the seagrass unigenes are highlighted and clickable, linking to the corresponding unigene entry in our database. (v) For browsing through domains, we provide two features to uncover domain annotations of particular interest. First, we use a tag cloud representation for each annotated Pfam domain where the observed domain frequency determines the size of its tag (Figure 1). Such a tag cloud provides intuitive and quick navigation through the most abundant domains found in the database. Second, a table containing domains that are significantly over-represented in either of the two seagrass species based on a χ2-test has been generated. Each of the listed domains is linked via the Pfam entry in our database where all associated transcripts and their numbers of reads are summarized.
The data interfaces among sequence, functional annotation and domain content allow the user to access the presented data in two complementary ways. First, we utilize interactive plots and tag clouds to allow for intuitive exploration of the data without any a priori research question. This is complemented by the ability to access data very selectively using complex search queries. For instance, if one is interested in candidate photosystem-related genes for heat stress experiments, search queries can be executed to find Z. marina unigenes that have been found to show a significant response to heat stress that were annotated with the keyword ‘photosystem’. Similarly, seagrass unigenes can be identified that can be used for population studies because they contain polymorphic molecular markers such as microsatellites or SNPs.
Applications
Other applications of the database include finding orthologous genes that are differentially expressed and inter-species comparison of domain abundance and bias. The results of these two example applications highlight the versatility and usefulness of Dr. Zompo, in particular for ecosystem research with multiple seagrass species.
Currently, the interpretation of these results can be cumbersome, since the available datasets have not been collected under controlled conditions. Accordingly, several variables such as collection depth, season collection, treatment and light conditions differ between the Posidonia and the Zostera dataset (see Methods section). These variabilities impact the statistical analysis such that observed differences cannot be attributed to one variable unequivocally. Despite these issues, the methods applied allow the identification of significant differences between the two EST datasets. Thus, a list of prime candidate genes was compiled which should be taken into account in further investigations when addressing the ecologically important question to understand how Zostera and Posidonia achieved adaptation to similar habitats. The work presented here demonstrates that significant insight can be gained with this limited dataset and that the described methods are in place for more comprehensive datasets that are expected in the near future for deeper analysis.
Comparing gene expression between orthologs
Alternative to functional substitutions in the coding sequence, gene expression modulation is a prominent mechanism to adapt to environmental changes at a cellular level (26). Tuning gene expression allows for rapid phenotypic changes while maintaining functional robustness of the underlying regulatory modules (27,28). Comparing expression levels of orthologous genes between Posidonia and Zostera provides insight into the global similarity of the transcriptomes that is a good indication for the degree of independent adaptation by the same mechanisms. Furthermore, differences of gene expression for gene clusters based on functional modules reflect non-parallel, lineage-specific adaptation to similar habitats.
In order to infer the overall similarity of the expression states between the two seagrasses, the transcription levels (i.e. the number of reads) between the orthologs were compared using Pearson correlation. Unigenes with significantly different numbers of reads (outliers) were determined using a χ2-test with P ≤ 0.01. To ensure that observed differences were not induced by the heat stress treatment, all cases where the Zostera unigene was found to be heat-responsive based on statistical evaluation of the read distribution in normal and heat-stressed libraries, as published before (17), were removed. Orthologs between the two seagrass species were determined by using a very conservative reciprocal best BLAST hit method on the protein sequence level. A threshold of E-value ≤ 1e−10 was used to define orthologs that have reciprocal best hits within the whole dataset, with the criteria that the region of similarity must span at least 80 amino acid residues with a minimum of 35% sequence identity.
The transcription level of the identified 207 seagrass orthologs were found to be significantly correlated (Pearson correlation coefficient r2 = 0.48, P = 1e−13). We tested if this could be a consequence of very low numbers of reads (between 1 and 3) that is observed for the vast majority of transcripts. When including only orthologous pairs where both members had a minimum number of reads, the correlation coefficient remained quite stable. Correlation of the 79 ortholog pairs with more than one read resulted in r2 = 0.54 (P = 3e−7); 27 orthologs with reads >3 produced r2 = 0.49 (P = 0.009). Therefore, it can be concluded that the total expression of orthologs between Z. marina and P. oceanica is significantly similar. This is quite remarkable for two reasons: first, their evolutionary distance is large since the two seagrass lineages have split probably before returning into the sea. Second, the Zostera dataset contained two heat stress libraries whereas Posidonia ESTs were exclusively collected under natural conditions.
As deviations from this general observed correlation between ortholog expression levels, we identified 33 orthologs that showed significant differences in transcription levels when comparing the Zostera and the Posidonia dataset (Table 2). Although the libraries are not 100% comparable (see above), those genes are nonetheless prime candidates for further in-depth investigations addressing questions on parallel evolution between the two seagrass lineages.
List of Zostera–Posidonia ortholog pairs that were found to have significantly different expression levels (i.e. number of EST reads)
| Zostera marina ID | Posidonia oceanica ID | Expected | Observed | χ2 | SwissProt annotation |
|---|---|---|---|---|---|
| Zoma_ZMD12058 | Pooc_Contig125 | 24.8 : 16.2 | 1 : 40 | 1129.59 | Oxygen-evolving enhancer protein 2-2,chloroplast precursor |
| Zoma_Contig902 | Pooc_Contig3 | 24.8 : 16.2 | 10 : 31 | 436.04 | Ribulose bisphosphate carboxylase small chainSSU5B, chloroplast precursor |
| Zoma_Contig740 | Pooc_Contig287 | 21.1 : 13.9 | 33 : 2 | 281.26 | Photosystem II 10 kDa polypeptide, chloroplastprecursor |
| Zoma_ZME03108 | Pooc_Contig281 | 10.9 : 7.1 | 1 : 17 | 194.94 | Probable glutathione S-transferase GSTU6 |
| Zoma_Contig116 | Pooc_Contig279 | 12.7 : 8.3 | 3 : 18 | 187.59 | Light-regulated protein precursor |
| Zoma_Contig825 | Pooc_PC010E04 | 11.5 : 7.5 | 18 : 1 | 85.11 | 40S ribosomal protein S11 |
| Zoma_Contig630 | Pooc_PC017D04 | 9.1 : 5.9 | 14 : 1 | 48.8 | Actin-depolymerizing factor 4 |
| Zoma_Contig609 | Pooc_Contig167 | 12.1 : 7.9 | 17 : 3 | 48.4 | 60S ribosomal protein L10 |
| Zoma_Contig14 | Pooc_Contig14 | 23.6 : 15.4 | 28 : 11 | 39.47 | Glyceraldehyde-3-phosphate dehydrogenase, cytosolic |
| Zoma_Contig680 | Pooc_PC019A01 | 7.9 : 5.2 | 12 : 1 | 34.4 | 40S ribosomal protein S18 |
| Zoma_Contig421 | Pooc_Contig242 | 12.1 : 7.9 | 16 : 4 | 30.72 | – |
| Zoma_Contig263 | Pooc_PC028C07 | 7.3 : 4.8 | 11 : 1 | 28.15 | Peptidyl-prolyl cis-trans isomerase |
| Zoma_Contig896 | Pooc_Contig170 | 11.5 : 7.5 | 15 : 4 | 24.83 | Translationally-controlled tumor protein homolog |
| Zoma_ZMC06047 | Pooc_Contig217 | 4.2 : 2.8 | 1 : 6 | 20.84 | – |
| Zoma_Contig8 | Pooc_Contig92 | 10.9 : 7.1 | 14 : 4 | 19.56 | Chlorophyll a-b binding protein 40, chloroplastprecursor |
| Zoma_Contig643 | Pooc_Contig193 | 9.1 : 5.9 | 6 : 9 | 18.73 | Nascent polypeptide-associated complex subunitalpha-like protein 1 |
| Zoma_Contig977 | Pooc_Contig19 | 6.0 : 4.0 | 3 : 7 | 18.49 | Photosystem I reaction center subunit XI, chloroplast precursor |
| Zoma_Contig679 | Pooc_Contig8 | 6.6 : 4.4 | 4 : 7 | 13.99 | ADP-ribosylation factor 1 |
| Zoma_ZME01071 | Pooc_Contig256 | 3.6 : 2.4 | 1 : 5 | 13.77 | 40S ribosomal protein S19 |
| Zoma_Contig828 | Pooc_PC046B10 | 5.4 : 3.6 | 8 : 1 | 13.15 | ATP synthase subunit d, mitochondrial |
| Zoma_Contig636 | Pooc_PC027E02 | 5.4 : 3.6 | 8 : 1 | 13.15 | – |
| Zoma_Contig195 | Pooc_PC034B02 | 5.4 : 3.6 | 8 : 1 | 13.15 | Adenosine kinase 2 |
| Zoma_Contig880 | Pooc_Contig271 | 8.5 : 5.5 | 11 : 3 | 12.94 | Inosine-5'-monophosphate dehydrogenase |
| Zoma_Contig748 | Pooc_Contig278 | 5.4 : 3.6 | 3 : 6 | 11.87 | Peroxiredoxin Q, chloroplast precursor |
| Zoma_Contig239 | Pooc_PC023A07 | 4.8 : 3.2 | 7 : 1 | 9.4 | – |
| Zoma_Contig69 | Pooc_Contig180 | 7.9 : 5.2 | 10 : 3 | 9.22 | Thioredoxin H-type 1 |
| Zoma_ZMF05139 | Pooc_Contig367 | 3.0 : 2.0 | 1 : 4 | 8.16 | 60S ribosomal protein L18-2 |
| Zoma_ZME04139 | Pooc_Contig4 | 3.0 : 2.0 | 1 : 4 | 8.16 | – |
| Zoma_ZMC13030 | Pooc_Contig83 | 3.0 : 2.0 | 1 : 4 | 8.16 | Pollen-specific protein C13 precursor |
| Zoma_ZMA09041 | Pooc_Contig264 | 3.0 : 2.0 | 1 : 4 | 8.16 | Nucleoside diphosphate kinase 1 |
| Zoma_Contig913 | Pooc_Contig362 | 4.8 : 3.2 | 3 : 5 | 6.71 | Zeaxanthin epoxidase, chloroplast precursor |
| Zoma_Contig736 | Pooc_Contig211 | 4.8 : 3.2 | 3 : 5 | 6.71 | Acyl carrier protein 1, chloroplast precursor |
| Zoma_Contig488 | Pooc_Contig61 | 4.8 : 3.2 | 3 : 5 | 6.71 | 60S ribosomal protein L7-4 |
Expression levels were compared using a χ2-test with P ≤ 0.01, where the expected number of reads was determined by averaging the overall number of reads in both species considering their different library sizes. All ortholog pairs which contained Zostera unigenes that have been found to be responsive to the heat stress treatment were removed.
Inter-species comparison of domain abundance
Protein domains are evolutionarily conserved parts of proteins that typically correspond to distinct functional units. By determining the expression level of each domain, annotated using Pfam-A for the two seagrass species, the relative frequency of this functional module in the two EST datasets can be assessed. This allows for the identification of individual functional modules within proteins that may occur at different frequencies between the two sampled transcriptomes of Z. marina and P. oceanica. Since both organisms occupy similar ecological niches, one would expect to find all domains to occur at similar frequencies across the two datasets. In contrast, strongly biased domain frequencies between the two species should be a consequence of one or multiple external factors. While being aware of the limitations mentioned before, we consider species differences (e.g. dissimilar expansion of gene families) by chance or as a consequence of adaptation to slightly different ecological niches, or differences in the expressed repertoire of genes as most likely explanations.
For each species, an approximation of the expression level for each domain was obtained by summing up the number of EST reads associated with the specific domain. Based on the assumption of uniform distribution, expected frequencies were computed for each domain while having corrected for the different sizes of the transcriptomes. In a χ2-test, observed and expected number of occurrences were compared, which yielded 25 cases where the domain abundance differed significantly between the two seagrass species (P ≤ 0.05, FDR corrected, see Supplementary Table 3).
Six out of 15 domains were found to be over-represented in P. oceanica and are associated with the photosystems and the photosynthetic process, in general. Moreover, at least three out of the unequally distributed domains are clearly associated with response to stress and/or pathogens (Harpin-induced protein 1, Glycine rich protein family, Gamma-thionin family) which could indicate that the sampled seagrasses were exposed to a distinct set of external stimuli to which they had to react to.
The strongest signal was found in the metallothionein (MT) protein family domain which is important for protein interactions with heavy metals such as zinc, copper, cadmium or nickel. In animals and fungi, MTs have been found to be involved in detoxification of heavy metals (29); in plants first evidence suggests a role in metal homeostasis (30,31). The precise function of MTs, however, is still to be determined. Since the contig with the highest number of reads in both datasets is similar to known metallothionein proteins (Zoma_Contig761 and Pooc_Contig198), MT function seems to be extremely important for both species. From studies in P. oceanica, MTs are already known to comprise a multi-gene family of at least five members (13), enabling the seagrass to absorb and accumulate metals in its organs and tissues after uptake from sediments (32,33). Moreover, P. oceanica is considered as a bioindicator for mercury since it can live at mercury rich sites (34).
The high frequency of MT domains observed in Posidonia is a direct consequence of significant similarity of the Pfam-A domain model to the highly expressed contig in Posidonia, but not that of Zostera. Although both Zostera and Posidonia unigenes contain an ORF with the same region of the protein and is of similar length, only the Posidonia contig matched the metallothionein Pfam-A domain model well (E = 2.6e−43). The Zostera contig Zoma_Contig761 probably contains a divergent variant of this domain, as it can be found with a relaxed E-value threshold (E = 0.0015). Interestingly, two Posidonia transcripts (Pooc_Contig300 and Pooc_Contig55) sharing high sequence similarity with the highly expressed Zoma_Contig761 show almost no sequence similarity to the MT Pfam domain (E = 0.00037). All in all, those unigenes are likely to represent different members of the MT gene family and, according to the samples we have gathered, the two seagrass species have distinct combinations of expression levels within this gene family.
Concluding remarks
In addition to the ecological importance of seagrasses to the planet, this group of flowering plants provides extraordinary grounds for evolutionary analysis due to their specific evolutionary history. The results from the analysis of the first EST data, obtained for two representative seagrass species of independent lineages, are presented with interesting findings for the evolution of orthologs at the domain level. The analysis was facilitated by Dr. Zompo which has been designed to manage and explore seagrass ESTs and genomic data from various species. This new database is the first large-scale resource designed specifically to accommodate seagrass sequence data. And such repository will be of high value in bridging the gap between the genomic resources of model organisms and seagrass species. Furthermore, the database provides experimentalists with a base knowledge upon which to build experiments. For instance, it can be used for finding experimentally verified homologs in other plant genes, or as a basis to target primer design for specific genes or molecular markers.
Dr. Zompo is not limited to the seagrass community and will be an important contribution to the general plant research community. This resource is expected to grow alongside with ecological and global warming-related research focuses that are gaining momentum (35). The database will be consistently updated and extended to broaden the content scope to include available data through addition of more species, and by adding more comprehensive and detailed annotations as they become available. Comprehensive collections of transcriptome data for the two sister species Z. marina and Z. noltii using the 454 next-generation sequencing technology will soon be gathered. Moreover, the full genomes of Z. marina and Spirodela polyrhiza (Great Duckweed) are expected by the end of 2009 (Joint Genome Institute, http://www.jgi.doe.gov/). Such extensions will promote the usefulness of this data repository even beyond its current status.
Acknowledgements
We thank the FP6 NoE Marine Genomics Europe (EC contract reference: GOCE-CT-2004505403) for supporting part of the EST sequencing through two small grants at the Technological Platform MPI in Berlin-Dahlem. We also thank the Molecular Biology Service at SZN, Italy for making part of the sequences and for providing technical support throughout the project. E.D. is a PhD student (tutor Prof. A. Innocenti) of the Dipartimento di Ecologia, Università della Calabria, Rende (CS), Italy. T.B.H.R. acknowledges funding through the DFG (Deutsche Forschungsgemeinschaft, Re 1108/9 AQUASHIFT). E.B.B. and A.D.M. acknowledge support by the DFG (Deutsche Forschungs Gemeinschaft) through grant BO2544/4-1.
Conflict of interest. None declared.
