


Abstract
With large-scale genomic data becoming the norm in biological studies, the storing, integrating, viewing and searching of such data have become a major challenge. In this article, we describe the development of an Arabidopsis thaliana database that hosts the geographic information and genetic polymorphism data for over 6000 accessions and genome-wide association study (GWAS) results for 107 phenotypes representing the largest collection of Arabidopsis polymorphism data and GWAS results to date. Taking advantage of a series of the latest web 2.0 technologies, such as Ajax (Asynchronous JavaScript and XML), GWT (Google-Web-Toolkit), MVC (Model-View-Controller) web framework and Object Relationship Mapper, we have created a web-based application (web app) for the database, that offers an integrated and dynamic view of geographic information, genetic polymorphism and GWAS results. Essential search functionalities are incorporated into the web app to aid reverse genetics research. The database and its web app have proven to be a valuable resource to the Arabidopsis community. The whole framework serves as an example of how biological data, especially GWAS, can be presented and accessed through the web. In the end, we illustrate the potential to gain new insights through the web app by two examples, showcasing how it can be used to facilitate forward and reverse genetics research. Database URL:http://arabidopsis.usc.edu/
Introduction
The drastic improvements of sequencing and genotyping technology, driven by the human genome project, have made it easier than ever to obtain genome-wide genetic data. Recently, genome-wide association study (GWAS), which is a genome-wide search for associations between genetic variation and a specific trait, such as type 2 diabetes, has been applied to successfully dissect a variety of complex traits (1). In this article, we describe the development of an Arabidopsis thaliana MySQL database (MySQL dump download: http://arabidopsis.usc.edu/db_dump.sql.gz) that hosts the geographic information and genetic polymorphism data for over 6000 accessions and GWAS results for 107 phenotypes (2) representing the largest collection of Arabidopsis polymorphism data and GWAS results to date.
Data warehousing is only the first step in overcoming large volumes of data and SQL server technology can handle this very well with minimal human input after the initial design phase. The next challenge is to make sense of the data, and communicate it to colleagues in a meaningful and concise manner (3). To this end computer-based visualization has helped. In some fields, such as genome visualization, researchers have a rich toolbox of visualization software at their disposal, many usable by non-experts (4). Visualization of GWAS results, however, is still in its infancy, partly due to the difficulty in integrating the vastly diverse data involved.
The web-based application (web app) we created takes advantage of a series of web 2.0 technologies, such as Ajax (Asynchronous JavaScript and XML), GWT (Google-Web-Toolkit), MVC (Model-View-Controller) web framework and Object Relationship Mapper to offer a dynamic and integrated view of geographic information, genetic polymorphism and GWAS results. Essential search functionalities are incorporated into the web app to aid reverse genetics research. The database and its web app have proven to be a valuable resource to the Arabidopsis community. The whole framework serves as an example of how biological data, especially GWAS data, can be presented and accessed through the web. In the end, we illustrate the potential to gain new insights through the web app by two examples, showcasing how it can be used to facilitate both the forward and reverse genetics research.
Database architecture and content
The database (Figures 1–4) comprises: one subdatabase hosting all GWAS data and affiliated genotype and phenotype data; four subdatabases that host low-throughput genetic polymorphism data generated by past technologies, used primarily for QC and one genome database storing the genome sequences, gene annotations, etc. The whole database is freely available on the web.
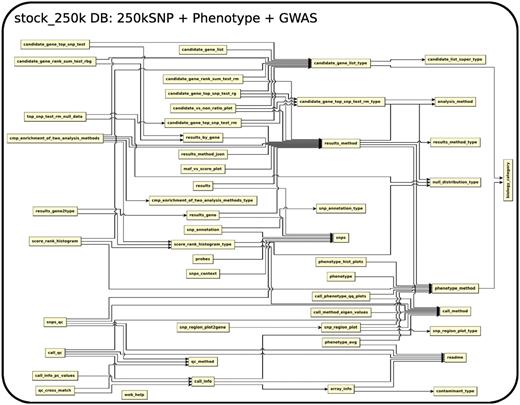
The relationship among tables in subdatabase stock_250k.
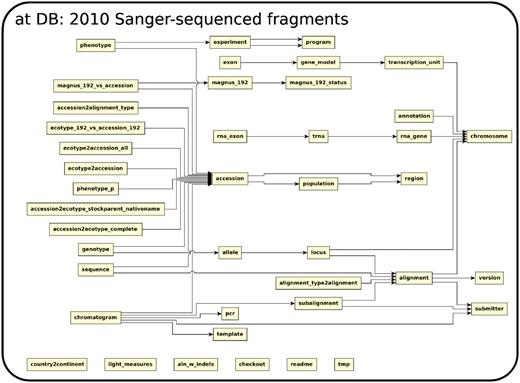
The relationship among tables in subdatabase at.
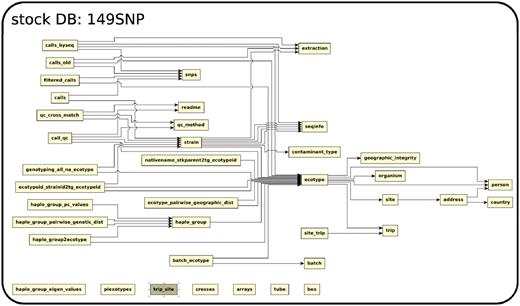
The relationship among tables in subdatabase stock.
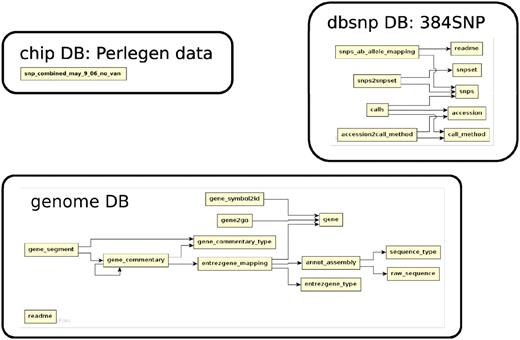
The relationship among tables in subdatabase chip, dbsnp and genome.
Collection of genetic polymorphism data
Over the past decade, several batches of A. thaliana genome-wide genetic polymorphism data have been generated via different technologies. In this section, we give a brief description of each data set. The latest 250kSNP data set (2) supersedes all previous data sets in terms of both marker density and the number of accessions sampled (Table 1). However, as some single data sets contain either more markers or more accessions than the 250 k SNP data set, which researchers might find useful, we have made them all available. In this article, we use the terms ‘ecotype’ and ‘accession’ interchangeably to mean a particular genetic line.
Summary of genetic polymorphism data stored in different sub-databases
| Data set name | DB name | No. of accessions | Avg. no. of SNPs per accession |
|---|---|---|---|
| 2010 | at | 249 | 21 485 |
| 384 | dbsnp | 96 | 384 |
| Perlegen | chip | 20 | 1 126 230 |
| 149SNP | stock | 5788 | 149 |
| 250kSNP | stock_250k | 199 | 216 132 |
| Data set name | DB name | No. of accessions | Avg. no. of SNPs per accession |
|---|---|---|---|
| 2010 | at | 249 | 21 485 |
| 384 | dbsnp | 96 | 384 |
| Perlegen | chip | 20 | 1 126 230 |
| 149SNP | stock | 5788 | 149 |
| 250kSNP | stock_250k | 199 | 216 132 |
The 2010 data set (5) stored in db at, was generated by direct Sanger-sequencing technology of 1500 fragments randomly picked throughout the genome in 96 globally sampled accessions. Each fragment is ∼700 bp long. The database has both raw fragments and processed polymorphism (SNP and small indels) data.
The 384 data set, stored in db dbsnp, was generated by mass-spectrometry at 384 random loci across the genome in a 96-accession sample that differs from that of the 2010 data set.
The Perlegen data set (6), stored in db chip, was generated using a whole-genome tiling array with four different probes for each position of the genome. It includes the most divergent 20 accessions in the 2010 data set. The array discovered 1 126 230 SNPs, from which the 250kSNPs used in the GWAS of 107 phenotypes were chosen (7).
The 149SNP data set (8), stored in db stock, is a low-density SNP data set carried out by a mass spectrometry technology from SEQUENOM Inc. The 149 genome-wide loci were picked out of the polymorphic loci in the 2010 data set with a minor allele frequency near 0.5. This data set, covering over 7000 global accessions, was generated to study global diversity of A. thaliana populations, a pre-step for GWAS (2).
The 250kSNP data set (2), stored in db stock_250k, was carried out by the custom-designed chip described in (7). The 250 000 SNPs were chosen out of the 1 126 230 SNPs in the Perlegen data set by tagging algorithms described in (7). The number of accessions genotyped is 199, as published in (2).
The 2010 data set is of highest quality, closely followed by Perlegen, with estimated error rates for each <1%. The 384 and 149SNP data sets are of considerably worse quality, with estimated error rates around 5%. Due to its high density, the Perlegen data set is used in SNP filtering while a new data set (2010-384-149), which merges the other three (2010, 384, 149SNP; indicated in the order of precedence) is used in accession filtering for 250kSNP quality-control (2). Besides the meta-information described in the next section, the accession-search page of the web app (Figure 7) also reports whether specific polymorphism data is available for the queried accession. This enables researchers to choose accessions for follow-up studies.
Meta-information of A. thaliana accessions in DB stock
Over 7000 accessions were collected by research groups throughout the world (Figure 5) to be genotyped at 149SNP loci. We have kept various meta-information related to each accession, such as IDs used in stock centers, alias, stock-parent, collector name, date of collection and GPS location in an accession table to facilitate population genetic and ecological studies.
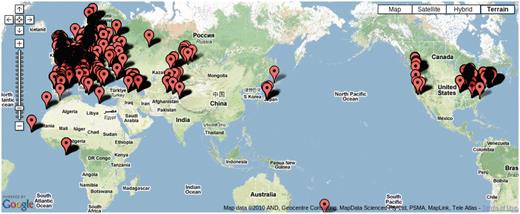
Map showing the location of 7075 accessions genotyped in the 149SNP data set.
Due to the scope of the project, tracking each individual accession has become an issue. GPS coordinates for a considerable number of accessions were initially incorrect. After original collectors were contacted for validation, some data remains uncertain. Poor maintenance of prior records, human error in recording and copying labels and machine errors in sequencing are all to blame. We explored the concordance between genetic clustering based on 149SNP and geographic clustering in order to identify errors. After filtering out poor-quality 149SNP genotype data, 5788 accessions were grouped into 1819 haplotype groups assuming a 5% genotyping error rate (8). In this context, a haplotype group is essentially a cluster of identical or very closely related individuals because haplotype is based on 149 genome-wide SNPs. We declared contamination upon finding geographic discordance within a haplotype group. Obvious candidates for contamination are accessions from the same haplotype group found in more than one continent (this includes the famous lab strains, Col and Ler) or when one or two members of a haplotype group are located far away from where the majority of the haplotype group are found. These cases most likely result from accessions being mixed up in the growth chamber, or mislabeled, although spread via human activity (boots, trains, greenhouse escapes) remains a possibility. Making this information public alerts researchers to avoid particular accessions if precise location information is required.
These data also serve as a potential barcoding resource. Some strains have very similar names, such as Tsu-1 and Tu-1. Inconsistency arises in research papers that refer to the same strain by different names or different strains by the same name. Genotyping at 149SNP loci is a cost-effective way to eliminate ambiguity.
Phenotype and association results in DB stock_250k
The 107 phenotypes used in the recent A. thaliana GWAS (2) are all available in the stock_250k database, courtesy of our numerous collaborators.
The phenotypes fall into 4 categories: 23 are flowering time measures under different environmental conditions; another 23 are related to defense, such as response to specific bacterial pathogens, trichome density on the leaf disks, etc.; 18 are the concentrations of elements measured using inductively coupled plasma mass spectroscopy (‘ionomics’) and the remaining 43 belong to a loosely defined group of developmental traits, including dormancy and plant senescence. The diversity and similarity among phenotypes is illustrated in a principal component analysis plot (Figure 6).The sample size is approximately 96 for all phenotypes except certain flowering time phenotypes which include an additional sample of 96 accessions.
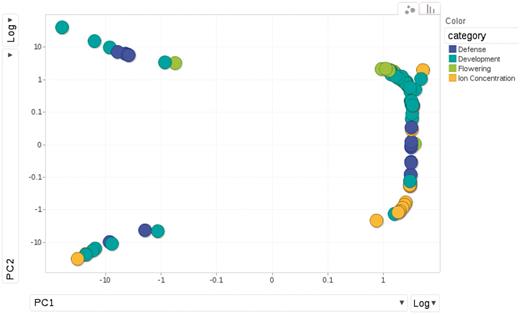
Relationships among phenotypes is plotted by the first and second princi pal components from PCA (Principal Component Analysis). Each dot represents one phenotype, colored according to the category to which it belongs.
A total of 214 association results, which include 107 phenotypes by two association methods (Wilcoxon and EMMA), based on the 250kSNP data set, can be found in the database. The full content of each association result is stored in the file and the database table ‘results method’ has a link to the file. The top 1000 associations from each are stored directly in the table ‘results’ with the position of each SNP, the score or P-value, allele frequency, effect size (EMMA only) and variance explained (EMMA only). Another table, ‘results gene’, records the top 1000 associations in a gene-centric way by linking association scores and ranks to the genes within 20 kb of SNPs. The specific relationship between all SNPs and their adjacent genes are stored in the table ‘snps context’. More detailed SNP annotations such as whether it is in a UTR, exon, intron or intergenic region; whether it is synonymous, non-synonymous, splice-donor, splice-acceptor or premature-stop-codon, is stored in the table ‘snp annotation’. The basic information of the genes, including description, type of gene, position and the associated GeneOntology terms, curated by TAIR, but was directly retrieved from the NCBI Gene Database and stored in a local genome database to ease cross-linking.
Functionality of the web app
Despite its strength in maintaining data integrity, a database without an easy-access interface fails to realize its potential in helping researchers with their work. Data are typically stored in an unfamiliar fashion with complex relationships among tables, making it difficult to interact directly with the database. The technology behind the web app will be discussed in the next section. Here, we focus on the functionality made possible through the innovative interface. The interface has three main entry points.
The accession page, http://arabidopsis.usc.edu/Accession/ (Figure 7), provides entry to the meta-information associated with accessions stored in the db. To facilitate communication, we set up an ID system that uniquely identifies each accession. Each ID is associated with all types of names that have been used, that is, nativename, name, alias, etc. The accession ‘By Name’ page allows researchers to search through all accessions using only one or two letters of the name through the adoption of auto-completion and regular expression functionality. The server returns a table of all search candidates with ID, polymorphism information, stock parent and geographic information, together with an interactive map of where all candidates are located (implemented via the Google Map API), with the entries in the table and map linked. Clicking one result, in either the table or map, highlights the corresponding entry in the other widget, thus helping to identify accessions quickly.
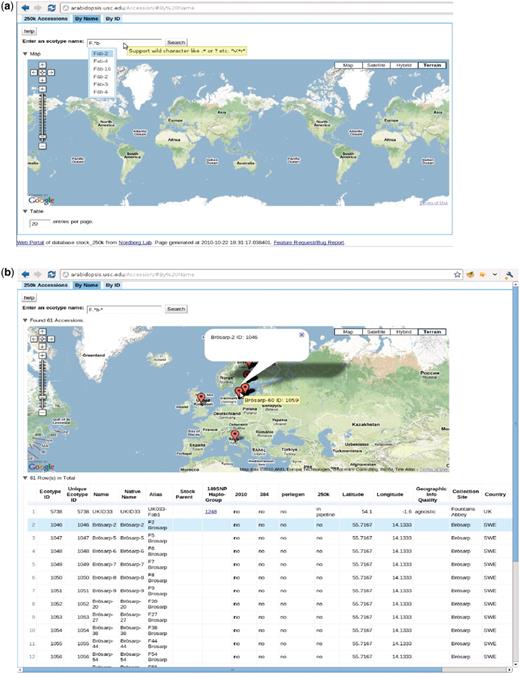
http://arabidopsis.usc.edu/Accession/ (a) Accession search interface, with auto-completion in action and support of regular-expression search. (b) Table of accessions returned.
The ‘149SNP Haplo-Group’ column in the table contains the haplotype group (8) ID. Clicking on the haplotype group, opens a new window that displays all the accessions found that are identical to the selected accession, thus giving a visual impression of how far one clone has spread or how likely it is that contamination has occurred. However, some of those clones might be close relatives due to the low resolution of the 149SNP data.
The phenotype page, http://arabidopsis.usc.edu/DisplayResults/ (Figure 8), provides entry to all GWAS results. It has four tabs under which one category of phenotypes is displayed in a single table. The table, with each row containing information relevant to a phenotype, is generated dynamically based on the data stored in the database. Content changed inside the database is immediately reflected on the web. Clicking on the column header enables the user to sort all phenotypes based on the value of that column. Clicking on a row produces a small popup with three links. The first link leads to a window containing more detailed information and a histogram of the phenotype. This phenotype-only window also includes an interactive motion chart to view the accessions in four dimensions (any four combinations of phenotype, latitude, longitude, PC1, PC2) simultaneously (Figure 9). This offers an easy way to visualize the extent of confounding due to population structure in different phenotypes. The second link leads to a window of interactive GWAS plots (Figure 10) besides the phenotype tab. The last one leads to tables of genes within 20 kb of top associated SNPs organized in different tabs by methods.
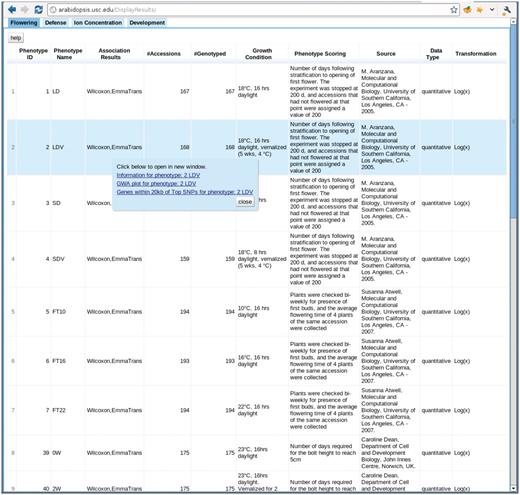
http://arabidopsis.usc.edu/DisplayResults/ One tab for each category of phenotypes. Under each tab is a dynamic table filled with phenotypes. Clicking on each phenotype shows a popup with links to detailed phenotype information, GWAS plots (Figure 7) and genes adjacent to top associations.
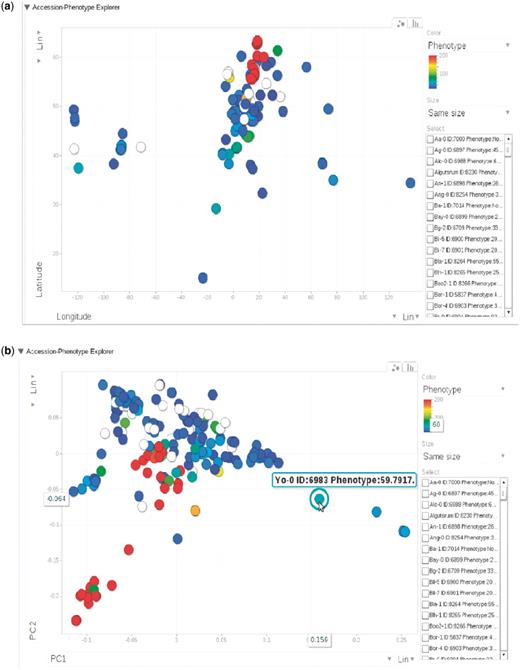
(a) Phenotype for each accession, represented by dots, plotted by longitude and latitude. The plot is visualized through Google Motion Chart. (b) Change the two axes in (a) to the first two principal components from PCA analysis on the genotype matrix. Mouse-over or clicking each dot in the chart displays the information for that accession. This dynamic widget is available in any phenotype page. The example used here is at http://arabidopsis.usc.edu/DisplayResults/showGWA?call_method_id=32&phenotype_method_id=1.
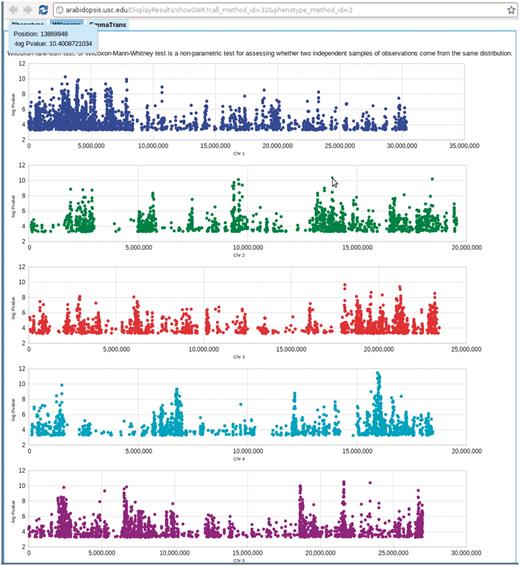
Genome-wide association P-values plot. Mouse-over each dot shows the position and P-value of the SNP. Clicking each dot results an 80 kb zoom-in SNP page (Figure 8). This visualization is done by Google Visualization Scatter Chart. This visualization is available in any phenotype page. The example used here is at http://arabidopsis.usc.edu/DisplayResults/showGWA?call_method_id=32&phenotype_method_id=2.
Clicking any dot in the interactive GWAS plots would lead to a single SNP view, (Figure 11), which has five tabs: close-up of the association in Gbrowse (9); a table summarizing the information related to the SNP; a table of associations from other phenotypes in which this SNP is ranked in the top 1000; an interactive motion chart displaying the accessions sorted by their phenotype or GPS values (Figure 12) and a table displaying the allele and phenotype value for each accession.
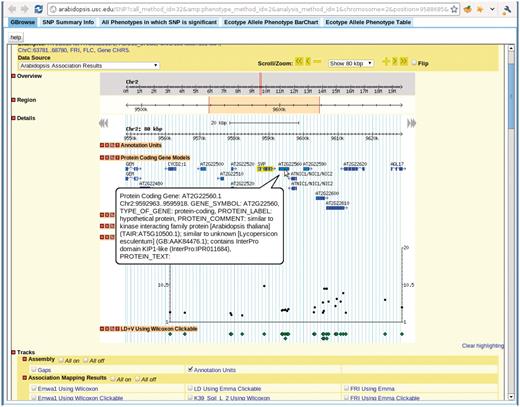
View for the SNP selected in Figure 7. There are five tabs in the view. First tab, GBrowse, is a close-up of the association around the SNP. The ‘SNP Summary Info’ tab lists the position, P-value, annotation of the SNP. The ‘All Phenotypes in which SNP is significant’ tab lists other phenotypes in which this SNP is among the top 1000 associations. The ‘Ecotype Allele Phenotype BarChart’ is described in Figure 9. The ‘Ecotype Allele Phenotype Table’ is a table listing which accession carries which allele and the corresponding phenotype. This example is from http://arabidopsis.gmi.oeaw.ac.at:5000/SNP/?call_method_id=32&phenotype_method_id=2&analysis_method_id=1&chromosome=2&position=9588685&score=10.1255444864.
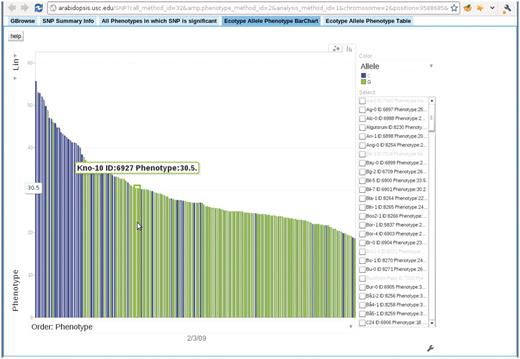
Bar chart depicting the correspondence between accession allele and phenotype. In this bar chart, each bar represents an accession and is colored according to the allele the accession carries. The height of each bar corresponds to the phenotype of the accession. All accessions are sorted horizontally according to their phenotype. Mouse-over each bar displays the information of that accession. This example is from the ‘Ecotype Allele Phenotype Barchart’ tab of http://arabidopsis.gmi.oeaw.ac.at:5000/SNP/?call_method_id=32&phenotype_method_id=2&analysis_method_id=1&chromosome=2&position=9588685&score=10.1255444864.
The ‘Search GWAS By Gene Name’ page, http://arabidopsis.usc.edu/DisplayResultsGene/geneForm/ (Figure 13), allows a user to search for associations of one gene acorss all GWAS results. A gene that is close to a significant SNP is far more interesting to researchers than the SNP itself. Due to the complex LD structure, the most significant SNP is usually not the true causal locus but just a marker for the true locus, which would typically be within 20 kb. However, in the compact genome of A. thaliana, 20 kb can contain tens or even hundreds of genes, all of which will consequentially have the same rank. It is often the case that genes known to be involved in phenotypes through prior molecular biology work are buried deep in the list of top 1000-ranked associations. Although, their ranks might not always be near the top, they tend to appear consistently in the associations of a similar group of phenotypes. This interface allows the researchers to put a gene they suspect to be involved in a phenotype into the cross-phenotype search. It returns a page, Figure 13b, including phenotype, SNP, rank, score, MAF, MAC, beta and variance explained (the latter two for EMMA results only). In another step, to bridge the gap between the database and ease of use, auto completion and regular expression functionality has been added.
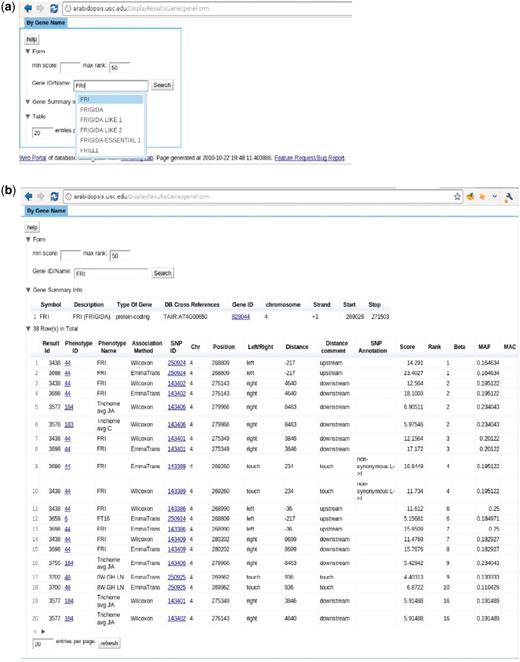
http://arabidopsis.usc.edu/DisplayResultsGene/geneForm/ (a) Search GWAS by gene name with auto-completion in action. (b) Table returned from the search.
To enable users to become familiar with the web app, we introduce two examples that present two common paths linking its different components. The first example (Figure 14) is based on forward-genetics analysis. Namely, given a trait of interest, how does a researcher find the potential loci or genes that are involved? The example trait is lesioning. The result is promising. ACD6, found to be most strongly associated with the phenotype (Figure 14), was confirmed to be the main locus through experiments (10). The second example is for reverse genetics (Figure 15). Given a gene, the researcher wants to find out phenotypes in which this gene is involved. In the example, we put the gene found in the prior forward genetics example (Figure 14), ACD6, to the test and found that, apart from the phenotypes closely correlated with lesioning, such as LY (lesioning and yellowing), ACD6 is also strongly associated with some disease resistance phenotypes, such as ‘Aphid number’ and ‘Emco5’, a second function of the gene which was again confirmed by (10).
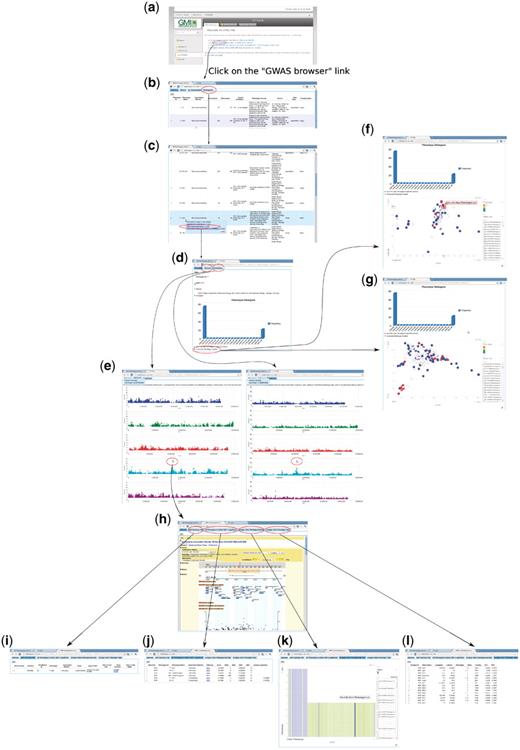
Forward genetics example. The trait of interest is LES (lesioning), which measures the presence of necrotic spots in normal plant leaves. The quest for its underlying genetic cause starts from http://arabidopsis.usc.edu/ (a). Then the researcher finds the trait in the table containing all phenotypes (b and c). Clicking the GWA plot item in the popup menu leads to the phenotype page containing a histogram (d) and genome-wide association plots by two different analysis methods, one that corrects for population structure; the other that does not (e). By clicking the ‘Accession-Phenotype Explorer’ in the phenotype page (d), the user could also explore the geographic distribution of phenotype (f) or check whether the phenotype is confounded by population structure by changing the axis to principal components (g). In this case, there is no population structure confounding, confirmed by the concordance between results by two different analysis methods (e). Clicking the most significant SNP in the association plot (e) leads the user to the SNP page, which displays a zoom-in association plot under the default tab (h). Combined with this SNP’s summary information (i), it points out gene ACD6 as the likely causal locus. The researcher can then find out whether this locus is strongly associated with other phenotypes (j), visually inspect how the phenotype is correlated with two alleles (k), and find out which accession carries which allele to pick accessions for downstream analysis (l).
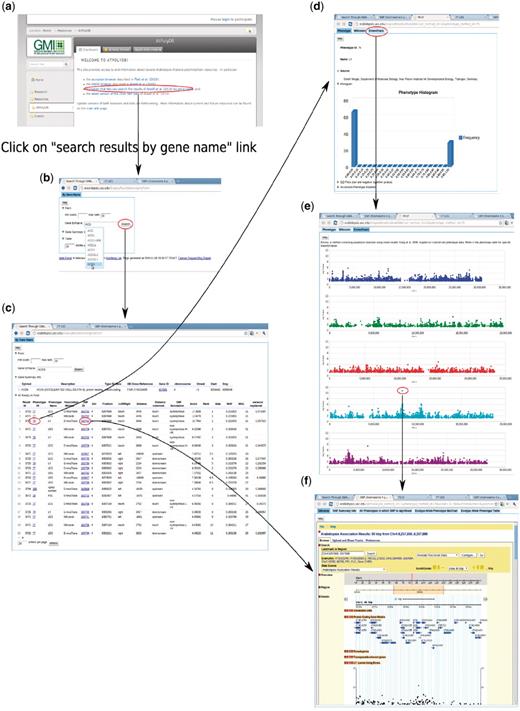
Backward genetics example. The gene of interest is ACD6. It starts from http://arabidopsis.usc.edu (a). Type the gene name in the search-GWAS-by-gene-name interface (b). Auto-completion is supported in case the researcher remembers only part of the name. The interface returns one table containing information about the gene, another table which includes all the associations ranked top in certain phenotypes (c), determined by the ‘max rank’ threshold in the interface. Then user can click either the phenotype ID to go to the phenotype page (d), which leads to a genome-wide association plot (e) as in Figure 10 or the SNP ID to go to the SNP page (f) directly.
Implementation of the web app and improvements over existing architecture
Our philosophy in implementing the web app is to allow the user be in charge of the data. For a user involved in genetic research of a certain trait, the ability to navigate between a genomic overview and a closeup, to search through all the information as easily as possible, and to view the data in an interactive manner is what matters the most. With the goal of presenting the machine-friendly database in an integrative and dynamic manner suitable for human interaction, we have applied the latest web technologies, so-called web 2.0, to our app. We are technology agnostic in the sense that any technology that can help achieve these goals would be utilized.
The technology side of the project is a mixture of old and new. In terms of programming languages, it involves python, java, javascript, sql, html. However, four major parts stand out (Figure 16): a relational database (MySQL or PostgreSQL), an SQL Toolkit and Object Relational Mapper (sqlalchemy, elixir), a MVC (Model-View-Controller) server (pylons) and an Ajax-filled (Google Web Toolkit, Google Visualization Toolkit) client end.
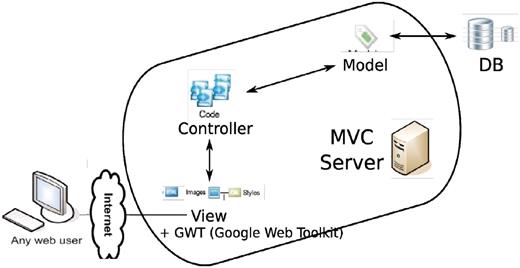
Overall architecture of the web app. An MVC (model-view-controller http://en.wikipedia.org/wiki/Model%E2%80%93view%E2%80%93controller) server, built out of pylons, is employed to separate the logic (model + controller) and user interface (view). The interaction between the MVC server and database server is facilitated by an ORM (object relational mapper) model. GWT is added to the view to enhance the user client experience.
The relational database is nothing new. However, most current GWAS interfaces interact with the database through raw SQL query. The SQL Toolkit and Object Relational Mapper (ORM), sqlalchemy, lets the user skip manual construction of complex SQL queries that frequently involves dozens of tables. Nevertheless, our interface still provides the full power and flexibility of a relational database. Its data abstraction layer allows construction and manipulation of SQL expressions in a platform agnostic way, enables a graph of objects and their dependencies to be loaded on demand and offers entire graphs of object changes to be committed in one step. It significantly reduces the programming overhead of dealing with a database.
MVC (model-view-controller) framework, unlike PhP or cgi-based frameworks, separates the logic and presentation of data. The model is the ORM described above, in charge of accessing and managing the data in the underlying database. The controller, representing the logic, is a collection of server-end functions that process the raw data fetched through the model and send them to the client, usually a web browser, for final presentation.
GWT (Google Web Toolkit), a development toolkit for building and optimizing complex browser-based applications, brings the web app much closer to a desktop application with tooltips, popup dialogs and especially auto-completion. Auto-completion has been such an essential part for any human–computer interaction as blank filling without any hint has been shown to turn potential users off and prompt them to leave the website. The Google visualization toolkit, which is tightly connected to GWT, enables fast and interactive plots in the browser on the fly. The end product of integrating these technologies is a powerful user interface for viewing GWAS data.
Discussion
Our framework still requires improvement in several areas. Access control of the data based on authentication of users is one of features commonly requested. The QTL (quantitative trait locus) mapping results through recombinant inbred lines, which offers a complimentary picture to GWAS, also needs to be integrated into the database. A more ambitious goal is to offer phenotype submission and full GWAS pipeline through the web; this capability is underway.
Funding
This work was primarily supported by US National Science Foundation (NSF) grant DEB-0519961 (J.B., M.N.), US National Institutes of Health (NIH) grant GM073822 (J.O.B.), and NSF grant DEB-0723935 (M.N.). Additional support was provided by the Dropkin Foundation, NIH grant GM057994 and NSF grant MCB-0603515 (J.B.), the Austrian Academy of Sciences (M.N.). The project would not have been possible without the existence of The Arabidopsis Information Resource (http://arabidopsis.org).
Conflict of interest. None declared.
