


Abstract
Model organisms are becoming increasingly important for the study of complex diseases such as type 1 diabetes (T1D). The non-obese diabetic (NOD) mouse is an experimental model for T1D having been bred to develop the disease spontaneously in a process that is similar to humans. Genetic analysis of the NOD mouse has identified around 50 disease loci, which have the nomenclature Idd for insulin-dependent diabetes, distributed across at least 11 different chromosomes. In total, 21 Idd regions across 6 chromosomes, that are major contributors to T1D susceptibility or resistance, were selected for finished sequencing and annotation at the Wellcome Trust Sanger Institute. Here we describe the generation of 40.4 mega base-pairs of finished sequence from 289 bacterial artificial chromosomes for the NOD mouse. Manual annotation has identified 738 genes in the diabetes sensitive NOD mouse and 765 genes in homologous regions of the diabetes resistant C57BL/6J reference mouse across 19 candidate Idd regions. This has allowed us to call variation consequences between homologous exonic sequences for all annotated regions in the two mouse strains. We demonstrate the importance of this resource further by illustrating the technical difficulties that regions of inter-strain structural variation between the NOD mouse and the C57BL/6J reference mouse can cause for current next generation sequencing and assembly techniques. Furthermore, we have established that the variation rate in the Idd regions is 2.3 times higher than the mean found for the whole genome assembly for the NOD/ShiLtJ genome, which we suggest reflects the fact that positive selection for functional variation in immune genes is beneficial in regard to host defence. In summary, we provide an important resource, which aids the analysis of potential causative genes involved in T1D susceptibility.
Database URLs:http://www.sanger.ac.uk/resources/mouse/nod/; http://vega.sanger.ac.uk/info/data/mouse_regions.html#Idd
Introduction
To solve complex diseases such as type 1 diabetes (T1D), efforts are increasingly turning to model organisms as a way of identifying causative genes. T1D is a polygenic disease resulting from the progressive autoimmune-mediated destruction of the insulin-producing pancreatic beta cells of the islets of Langerhans (1), whereas disease frequency is attributable to the interaction of the environment on alleles at numerous loci distributed throughout the genome (2, 3). During the past few decades, the incidence of T1D has increased in developing countries, indicating that changes in the environment such as diet and hygiene may have some influence on the disease (4, 5). Alleles that confer risk for autoimmune disease in both humans and mice are relatively common, suggesting that they may be involved in a different context such as heightened immune response to pathogenic invasion and that certain disease-causing variants may have other, as yet unknown, beneficial roles (6).
The non-obese diabetic (NOD) mouse was developed by intercrossing the spontaneous cataract outbred Jcl:ICR strain of mouse at the Shionogi Research Laboratories, for >20 generations in Japan in the 1970s (7, 8). The NOD mouse spontaneously develops T1D and is an experimental model for human T1D because it shares multiple characteristics with the human disease, including genetic polymorphisms that affect shared pathways, common antigenic targets and the expression of class II Major Histocompatibility Complex (MHC) molecules that display related peptides (8–10). In addition, the NOD mouse is a useful model for studying a range of other polygenic autoimmune diseases because it is also susceptible to developing disorders that include autoimmune sialitis, autoimmune thyroiditis and autoimmune kidney disease (8). Congenic mouse strain analysis has identified ∼50 genetic loci associated with T1D distributed over at least 11 different chromosomes (10), which have been given the nomenclature Idd for insulin-dependent diabetes (8, 11–13).
The NOD mouse sequence, annotation and variation resource
Although the use of congenic mouse strains is essential for the identification of putative disease regions, the ability to define candidate regions absolutely using such techniques is still limited (14). The Wellcome Trust Sanger Institute (WTSI) was awarded a grant by the National Institute of Allergy and Infectious Diseases (NIAID), the National Institute of Diabetes and Digestive and Kidney Diseases (NIDDK) and the Juvenile Diabetes Research Foundation International (JDRF) to undertake the targeted genome sequencing, annotation and analysis of specific Idd regions in the NOD mouse. To facilitate this, the initial phase of the NOD mouse project involved the construction of a bacterial artificial chromosome (BAC) clone-map over the C57BL/6J genome from two substrains of NOD mice. These were delivered via the Diabetes and Inflammation Laboratory (DIL) library, constructed from the NOD/MrkTac mouse strain, and the Children's Hospital Oakland Research Institute-29 (CHORI-29) library, constructed from the NOD/ShiLtJ mouse strain (15). Both libraries had BAC end-sequences produced, which were then aligned and displayed in the Ensembl genome browser (15, 16).
Idd intervals that are major contributors to T1D susceptibility or resistance that could be mapped to intervals of fewer than three megabases (Mb) were considered for sequencing on a case-by-case basis by the project’s External Advisory Committee at the National Institutes of Health (17). Statistical evidence showing that the genomic interval altered the frequency of diabetes and information on independent congenics that supported the definition of the Idd interval were also required. For example, in congenic mice, the Idd9 region has been shown to provide partial protection against diabetes when compared with the NOD mouse. Lyons et al. (18) showed that three Idd intervals were contained in this region. Fine-mapping of congenic strains refined the region from ∼48 centimorgans, to <4 Mb each, allowing these intervals to be put forward for sequencing. Likewise, the Idd6.1 and Idd6.2 regions, which provide resistance to T1D in the non-NOD strain of mouse (13), were localized by congenic analyses to a relatively small region of 5.6 Mb combined. The Idd18.2 interval spans a genomic distance of 7.4 Mb, as defined by the microsatellite markers AL645930.10.10 and AC093365_6. The C57BL/6J allele of Idd18.2 confers susceptibility to diabetes, whereas the NOD allele confers resistance to diabetes (12). However, although this region was deemed too large for clone-by-clone sequencing in this project, the ortholog of the human LYP gene (PTPN22), which is associated with several autoimmune diseases including T1D (19), is located in the Idd18.2 interval, which made it a good candidate for sequencing.
Clones covering defined Idd candidate regions were selected from either the DIL library or the CHORI-29 library using the BAC end-sequences that had been aligned to the Mouse Genome Sequencing Consortium v3 (MGSCv3) mouse reference genome in Ensembl (15). These clones were sequenced in their entirety and annotated at the WTSI. Where candidate genes were identified, BAC clones spanning the proposed candidate genes were sequenced rather than the entire genetic interval defined by the congenic strain, e.g. Idd5.4 and Idd18.2. In total, 21 regions were selected for finished sequencing and manual annotation.
As part of this project, the human and vertebrate analysis and annotation (HAVANA) team (20) provided manual annotation for the selected Idd regions. This involved building transcript models supported by transcriptional or translational evidence, primarily in the form of messenger RNA (mRNA), expressed sequence tag (EST) or protein homologies. Additional evidence of the completeness of a transcript, such as CpG islands or cap analysis gene expression (21) tags at the 5′ end or polyadenylation features at the 3′ end, were also used.
This research project provides a valuable resource that allows finished NOD mouse genomic sequence of the candidate Idd regions to be browsed and compared against the Genome Reference Consortium (GRC) m38 (22) C57BL/6J reference genome. This will help determine whether single-nucleotide polymorphisms (SNPs) or other genomic variations are associated with diabetes in mouse and by extension in human, facilitating the identification of any potential immunogenic proteins responsible for the initiation and progression of autoimmune destruction of pancreatic beta cells. As the ability to refine intervals increases, one possible outcome is that the number of candidate loci could increase with some Idd regions being subdivided further. In this article, we describe in detail the sequencing, annotation and analysis of regions of the NOD mouse genome that show high levels of T1D association. The results of this project have been made available publicly through the NOD mouse resource provided by the WTSI and will be essential in revealing the causative factors contributing to T1D and possibly other autoimmune diseases. Data submitted for this publication are also available via the NOD mouse ftp site (23).
Results
Sequencing
We have sequenced 289 BACs from the DIL and CHORI-29 NOD mouse libraries from 21 candidate Idd regions, generating a total of 40 395 555 base pairs (bp) of finished sequence. In total 1 155 916 Sanger capillary sequencing reactions were carried out with 804 182 (69.57%) reactions passing post-sequencing quality processing (24) successfully, with an average read length of 459 bp. The DIL NOD library generated 22 864 738 bp of sequence from 182 BACs across 14 candidate regions. In all, 711 649 sequencing reactions were attempted, with 505 115 (70.98%) reads passing post-sequencing quality processing with an average read length of 456 bp. Similarly, the CHORI-29 library generated 17 530 817 bp from 107 BACs across seven candidate regions. In all, 444 267 sequencing reactions were attempted, with 299 067 (67.32%) reads passing post-sequencing analysis with an average read length of 464 bp. Both NOD mouse libraries appear to sequence equivalently. Of the 289 clones that were sequenced, 276 needed further directed sequencing reactions to contiguate and finish the clone sequences. Thirteen NOD BAC clones exited the sequencing pipeline in a contiguous state requiring some manual intervention, but no further sequencing reactions. See Table 1 and Supplementary Data 1 for further information.
Regions sequenced in the two strains of NOD mouse showing numbers of sequenced bp and numbers of sequenced BACs
| Region | Chromosome | Strain | Library | Length bp | Number of BACs |
|---|---|---|---|---|---|
| Idd1 (MHC) | 17 | NOD/ShiLtJ | CHORI-29 | 4 810 977 | 29 |
| Idd1 (MHC) | 17 | NOD/MrkTac | DIL | 4 256 209 | 34 |
| Idd10 | 3 | NOD/MrkTac | DIL | 1 195 666 | 10 |
| Idd16.1 | 17 | NOD/ShiLtJ | CHORI-29 | 1 908 920 | 12 |
| Idd18.1 | 3 | NOD/MrkTac | DIL | 689 363 | 5 |
| Idd18.2 | 3 | NOD/MrkTac | DIL | 466 430 | 3 |
| Idd3 | 3 | NOD/MrkTac | DIL | 697 603 | 5 |
| Idd4.1 | 11 | NOD/MrkTac | DIL | 1 550 185 | 11 |
| Idd4.2 | 11 | NOD/MrkTac | DIL | 1 462 311 | 12 |
| Idd4.2Q | 11 | NOD/ShiLtJ | CHORI-29 | 3 086 744 | 18 |
| Idd5.1_CHORI | 1 | NOD/ShiLtJ | CHORI-29 | 456 798 | 2 |
| Idd5.1 | 1 | NOD/MrkTac | DIL | 853 859 | 7 |
| Idd5.3 | 1 | NOD/MrkTac | DIL | 3 710 957 | 32 |
| Idd5.4 | 1 | NOD/MrkTac | DIL | 326 027 | 2 |
| Idd6.1+2 | 6 | NOD/ShiLtJ | CHORI-29 | 5 657 964 | 35 |
| Idd6.AM | 6 | NOD/ShiLtJ | CHORI-29 | 1 609 414 | 11 |
| Idd9.1 | 4 | NOD/MrkTac | DIL | 2 950 841 | 25 |
| Idd9.1M | 4 | NOD/MrkTac | DIL | 215 692 | 2 |
| Idd9.2 | 4 | NOD/MrkTac | DIL | 2 864 054 | 22 |
| Idd9.3 | 4 | NOD/MrkTac | DIL | 1 625 541 | 12 |
| Total from DIL library | 22 864 738 | 182 | |||
| Total from CHORI-29 library | 17 530 817 | 107 | |||
| Total | 40 395 555 | 289 | |||
Candidate regions Idd6.1 and Idd6.2 were combined for ease of mapping and sequencing due to their proximity in the genome and are referred to as Idd6.1 + 2. Regions with a letter suffix distinguish regions originally given the same name but were located in different regions of the genome. Idd5.1_CHORI is contained wholly within DIL Idd5.1 and was sequenced to establish inter-NOD strain differences.
All sequences have been submitted to the European Nucleotide Archive (ENA) (25) part of the International Nucleotide Sequence Database Collaboration (INSDC) (26) and can also be downloaded from the NOD mouse webpage (27), which also provides a central point for information on the project. Finished clones from the targeted Idd candidate regions are displayed in the NOD clone sequence section of the website (28), where they can be downloaded either as individual clone sequences or larger contigs that make up the accession golden path. All the sequence for a specific region can be selected from the relevant chromosome dropdown menu and is also available via the GRC website (29).
Annotation
We have annotated 738 genes across 19 Idd candidate regions in the NOD mouse spanning 31 328 369 bp of finished sequence and 765 genes in the homologous regions in the GRCm38 C57BL/6J reference genome. The difference in total numbers of loci is partly due to some structural variation between the two mouse strains and sequence gaps in the Idd regions, making it difficult to predict accurately numbers of missing genes.
Four hundred and eighteen of the genes annotated on the genomic sequence in NOD mouse were coding, 396 of which were known and a further 22 were novel coding loci. One hundred and thirty-seven non-coding loci were annotated, 72 of which were long intergenic non-coding RNAs (lincRNAs), 59 were antisense to a coding gene and 6 were sense intronic to a coding gene. One hundred and eighty-two pseudogenes (135 processed and 40 unprocessed, 3 transcribed processed and 4 transcribed unprocessed) and one nonsense-mediated decay read-through transcript were identified.
Four hundred and thirty of the genes annotated on the GRCm38 C57BL/6J reference genome sequence were coding, 425 of which were known and a further 5 were novel coding loci. One hundred and fifty non-coding loci were annotated, 79 of which were long intergenic non-coding RNAs (lincRNAs), 65 were antisense to a coding gene and 6 were sense intronic to a coding gene. One hundred and eighty-four pseudogenes (147 processed and 26 unprocessed, 3 transcribed processed and 8 transcribed unprocessed) and one nonsense-mediated decay read-through transcript were identified.
The gene content of each annotated Idd region for the NOD mouse and C57BL/6J mouse (B6) is presented in Table 2 and in further detail in Supplementary Data 2.
Gene content for annotated Idd regions in the NOD mouse and C57BL/6J (B6) mouse
| Region | Chromosome | Loci | Coding | Non-coding | Pseudogenes | ||||
|---|---|---|---|---|---|---|---|---|---|
| NOD | B6 | NOD | B6 | NOD | B6 | NOD | B6 | ||
| Idd10* | 3 | 18 | 22 | 8 | 11 | 2 | 3 | 8 | 8 |
| Idd16.1 | 17 | 58 | 59 | 40 | 40 | 14 | 14 | 4 | 5 |
| Idd18.1 | 3 | 4 | 4 | 3 | 3 | 0 | 0 | 1 | 1 |
| Idd18.2 | 3 | 17 | 17 | 10 | 10 | 4 | 4 | 3 | 3 |
| Idd3 | 3 | 18 | 18 | 8 | 8 | 4 | 4 | 6 | 6 |
| Idd4.1* | 11 | 80 | 78 | 60 | 59 | 6 | 6 | 14 | 13 |
| Idd4.2 | 11 | 70 | 70 | 46 | 46 | 2 | 2 | 22 | 22 |
| Idd4.2Q | 11 | 64 | 64 | 40 | 40 | 16 | 16 | 8 | 8 |
| Idd5.1_CHORI | 1 | 11 | 12 | 3 | 3 | 2 | 2 | 6 | 7 |
| Idd5.1* | 1 | 15 | 38 | 5 | 11 | 3 | 12 | 7 | 15 |
| Idd5.3 | 1 | 23 | 25 | 10 | 10 | 5 | 5 | 8 | 10 |
| Idd5.4 | 1 | 7 | 7 | 4 | 4 | 3 | 3 | 0 | 0 |
| Idd6.1+2* | 6 | 76 | 82 | 36 | 38 | 25 | 26 | 15 | 18 |
| Idd6.AM* | 6 | 55 | 29 | 22 | 15 | 0 | 0 | 33 | 14 |
| Idd9.1* | 4 | 74 | 76 | 52 | 54 | 18 | 18 | 4 | 4 |
| Idd9.1M | 4 | 4 | 4 | 2 | 2 | 2 | 2 | 0 | 0 |
| Idd9.2* | 4 | 109 | 125 | 49 | 56 | 21 | 23 | 39 | 46 |
| Idd9.3 | 4 | 35 | 35 | 20 | 20 | 10 | 10 | 5 | 5 |
| Total | 738 | 765 | 418 | 430 | 137 | 150 | 183 | 185 | |
Note that regions marked with an asterisk indicate Idd regions where the sequence is not contiguous due to sequence gaps, which may be indicative of structural variation between the two mouse strains, or in the case of Idd5.1 and Idd10 where only portions of the defined candidate region were sequenced.
Manual annotation is made available publicly via the Vertebrate Genome Annotation (Vega) website (30) and can be accessed specifically from the mouse Idd regions section (31) (see Figure 1).
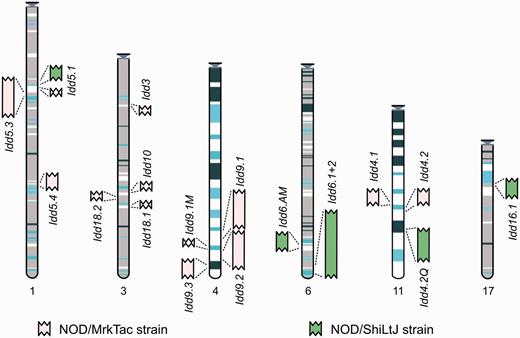
Entry point to the Idd regions in Vega. The regions are represented graphically and shown in the relative position they are found in the C57BL/6J genome. Each region links through to a regional summary. The MHC annotation will be available in the resource by mid-2013.
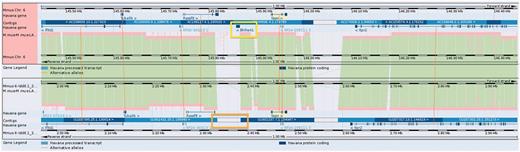
Differences between strains can be visualised in Vega where it is possible to compare genomic sequence and genes in the candidate loci and is a useful way of identifying regions of difference between the two mouse strains quickly (Figure 2). By making annotation available via Vega and/or Ensembl, it is also formatted to enable it to be imported into other genomes browsers such as T1DBase’s GBrowse (32) as required by collaborators.
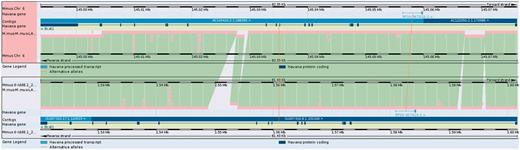
The NOD and C57BL/6J mouse sequences can be aligned against each other. Homologous genes are connected with lines to help identify them. Blocks of homologous sequence are coloured green, and regions with different sequence or no sequence are coloured light blue. It is clear that there are different intronic sequences present in gene Bcat1 in CHORI-29 (lower panel) with respect to C57BL/6J, possibly resulting in changes to regulatory regions or other functional sequences.
Variation
To get an insight into the differences between the annotated Idd regions of the NOD and C57BL/6J genomes, their sequences were compared, and the variation consequences were analysed. We found 123 926 SNPs and 18 821 indels across the annotated Idd regions (Table 3). As not all of the Idd regions were defined from congenic mice using the C57BL/6J mouse as the non-NOD strain, such as the C57BL/10SnJ mouse, this comparison is not correct. However, the best complete reference strain for variation work is C57BL/6J, and if one strain is to be used, then this is the best choice.
Number of changes by type and variation rate in the NOD Idd regions
| Region | SNPs | Indels | Length | SNPs/Mb | bp/SNP |
|---|---|---|---|---|---|
| Idd10 | 2833 | 485 | 1 531 595 | 1850 | 541 |
| Idd16.1 | 1598 | 464 | 1 774 776 | 900 | 1111 |
| Idd18.1 | 253 | 111 | 948 181 | 267 | 3748 |
| Idd18.2 | 1506 | 289 | 536 172 | 2809 | 356 |
| Idd3 | 3640 | 583 | 478 088 | 7614 | 131 |
| Idd4.1: 1-1248286 | 923 | 315 | 1 174 414 | 786 | 1272 |
| Idd4.2 | 534 | 173 | 1 490 088 | 358 | 2790 |
| Idd4.2Q | 16 787 | 2543 | 2 526 934 | 6643 | 151 |
| Idd5.1 | 3191 | 466 | 2 736 539 | 1166 | 858 |
| Idd5.1_CHORI | 1157 | 233 | 400 982 | 2885 | 347 |
| Idd5.3 | 35 745 | 4311 | 3 033 670 | 11 783 | 85 |
| Idd5.4 | 599 | 126 | 221 559 | 2704 | 370 |
| Idd6.1_2 | 23 206 | 3528 | 5 528 888 | 4197 | 238 |
| Idd6.AM: 2496-440951 | 5202 | 480 | 425 133 | 12 236 | 82 |
| Idd9.1 | 8601 | 1634 | 2 896 193 | 2970 | 337 |
| Idd9.1M | 1 | 3 | 127 081 | 8 | 127 081 |
| Idd9.2: 1066933-3054144 | 13 443 | 2148 | 1 861 587 | 7221 | 138 |
| Idd9.3 | 4707 | 929 | 1 336 693 | 3521 | 284 |
| All | 123 926 | 18 821 | 29 028 573 | 4269 | 234 |
Fragments with structural variation were removed from Idd4.1, Idd6.AM and Idd9.2. Length shown is the remaining after repeat masking the region sequence.
The average variation rate of the Idd regions attending to SNPs alone is one change every 234 bp, ∼2.3 times higher than the mean variation rate of the NOD/ShiLtJ genome (Table 4) calculated according to data from a previous study (33).
Number of SNPs and variation rate in the annotated Idd regions and the whole NOD/ShiLtJ genome
| Region | SNPs | Length | SNPs/Mb | bp/SNP |
|---|---|---|---|---|
| ALL Idd regions (BAC) | 123 926 | 29 028 573 | 4269 | 234 |
| ALL Idd regions (MGP) | 102 848 | 29 362 570 | 3503 | 285 |
| NOD/ShiLtJ genome (MGP) | 4 168 714 | 2 233 177 854 | 1867 | 536 |
| Region | SNPs | Length | SNPs/Mb | bp/SNP |
|---|---|---|---|---|
| ALL Idd regions (BAC) | 123 926 | 29 028 573 | 4269 | 234 |
| ALL Idd regions (MGP) | 102 848 | 29 362 570 | 3503 | 285 |
| NOD/ShiLtJ genome (MGP) | 4 168 714 | 2 233 177 854 | 1867 | 536 |
Length for the MGP data refers to the number of confidently mapped bases (see ‘Materials and Methods’ section).
We next analysed whether the BAC-based sequencing project had provided a more comprehensive set of variants than the Mouse Genomes Project (MGP) (34) NOD/ShiLtJ genome sequencing. The MGP found 98 480 high-quality SNPs in confidently mapped positions in the annotated NOD Idd regions, of which 92 770 (94.2%) were confirmed by this study that, in addition, identified 5649 unique SNPs (Figure 3). Of these, 4363 were novel or at least not present in dbSNP when this analysis was performed.
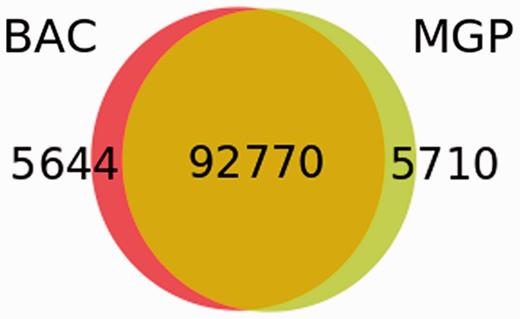
Comparison of SNP sets in the NOD Idd regions obtained by the BAC sequencing and the MGP.
To minimize the possible data distortion introduced by sequence gaps, structural variation and so forth, we restricted the study of the variation effects on the Idd annotation to the homologous transcripts between the NOD and C57BL/6J genomes. Approximately 4.4% of variants were discovered in exons. Among them, 1428 synonymous coding, 640 non-synonymous coding and 26 codon changes were found across all coding transcripts (Table 5). A similar number of changes involved non-coding transcripts in protein-coding genes (2142), while variation also affected exonic regions of long non-coding RNA (lncRNAs) genes (736) and pseudogenes (660). Details of the most significant variation consequences at the gene level for all annotated regions can be seen in Figure 4. See Supplementary Data 3 for detailed SNP consequences for all annotated Idd regions.
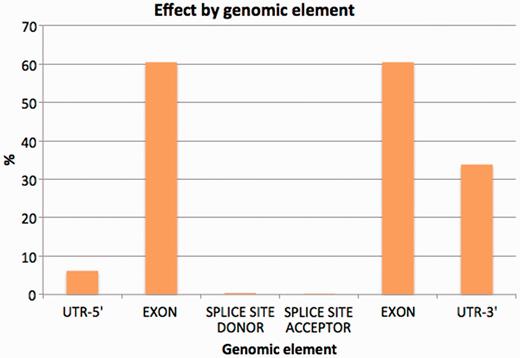
Percentage of variants affecting each genomic element (introns excluded from the chart).
Effects of the variation between homologous transcript sequences of the NOD and C57BL/6J Idd regions on the GRCm38 reference genome annotation
| Variation effect | All transcripts | Canonical transcripts |
|---|---|---|
| CODON_CHANGE_PLUS_CODON_DELETION | 8 | 2 |
| CODON_CHANGE_PLUS_CODON_INSERTION | 2 | 2 |
| CODON_DELETION | 6 | 3 |
| CODON_INSERTION | 10 | 5 |
| EXON | 2142 | 0 |
| FRAME_SHIFT | 7 | 3 |
| INTRON | 189 366 | 61 717 |
| NON_SYNONYMOUS_CODING | 640 | 326 |
| SPLICE_SITE_ACCEPTOR | 3 | 0 |
| SPLICE_SITE_DONOR | 12 | 6 |
| START_GAINED | 68 | 17 |
| STOP_GAINED | 1 | 1 |
| STOP_LOST | 1 | 0 |
| SYNONYMOUS_CODING | 1428 | 723 |
| SYNONYMOUS_STOP | 4 | 3 |
| UTR_3_PRIME | 2372 | 1192 |
| UTR_5_PRIME | 571 | 230 |
| WITHIN_NON_CODING_GENE | 736 | 609 |
| WITHIN_PSEUDOGENE | 660 | 636 |
The account of effects varies as all homologous transcripts in a gene or only the canonical transcript (the one with longest CDS or the longest length) are considered. EXON, WITHIN_NON_CODING_GENE and WITHIN_PSEUDOGENE refer to variants affecting exons of non-coding transcripts in coding genes, lncRNA genes and pseudogenes, respectively.
Discussion
Sequence
Currently there is sequence available for 21 Idd candidate regions in the NOD mouse from two different substrains. Clones from the CHORI-29 and DIL library were sequenced across chromosomes 1, 3, 4, 6, 11 and 17. These include the MHC (Idd1), to date the only Idd region identified as essential for the manifestation of T1D (8), which was sequenced in both mouse strains.
The initial construction of the NOD mouse BAC libraries and subsequent mapping of the BAC end-sequences to the GRCm38 C57BL/6J reference genome has facilitated the targeted sequencing of NOD mouse Idd susceptibility loci. Confirmation of a contiguous tile path for targeted CHORI-29 and DIL clones required that the underlying C57BL/6J genome was sufficiently homologous so that the positioning of the NOD BAC end-sequences could be established confidently (15). Although it might be possible to identify the location of specific genes in the NOD genome from just the BAC end-sequence positioning, potential diabetes specific differences are unlikely to have been inferred from the BAC end-sequence alignments alone. Most of the sequenced NOD BAC clones appear to have a co-linear relationship with the GRCm38 C57BL/6J reference genome, although some significant differences in the amount of sequence and/or number of genes present between the GRCm38 C57BL/6J reference genome and the NOD genome have been identified in Idd6.AM (35), Idd4.1 (36) and Idd9.2.
A number of smaller gaps remain in the CHORI-29-derived Idd1 MHC region, Idd6.1+2 and Idd9.1, where it was not possible to define tilepaths across the regions of interest, which again is suggestive of either inter-strain structural variation or a lack of sequencing coverage of appropriate BACs. Other remaining gaps were due to using a targeted-gene sequencing approach.
Using the Illumina platform (37), the Mouse Genomes group has produced a whole genome assembly for the NOD/ShiLtJ mouse genome (33), which used the CHORI-29-derived BAC sequences to calibrate the SNP calling software. However, the error rate in these assemblies could be higher than the genetic differences between the NOD mouse and the C57Bl/6J mouse. Furthermore, this assembly was guided by the MGSC37 C57BL/6J reference genome and as such would be biased towards the reference sequence. Although the variation information gained from the mouse genomes in this project has been essential, difficulties in producing reliable sequence in regions where structural variation exists continues to prove problematic. Thus, the importance of generating finished sequence rather than draft sequence cannot be over-emphasized, as errors in the genomic assembly, which arise from draft sequence can lead to false variants being called as well as miss-assemblies and missing sequence. Although regions of structural variation between C57BL/6J and NOD mouse can be identified clearly by full BAC sequencing, regions that are deleted or expanded in NOD mouse with respect to C57BL/6J are difficult to identify in the next-generation sequencing derived assembly. Supplementary Data 4 illustrates two regions of structural variation between C57BL/6J and NOD mouse, Idd6.AM and Idd4.1, and the clear technical difficulties that such regions currently cause for current next-generation sequencing and assembly techniques versus traditionally derived sequencing and assembly methods. The dotplots were created using Dotter (38), whereas the next-generation assembly is viewed using LookSeq (39) via the Mouse Genomes webpage.
However, the NOD/ShiLtJ mouse has been re-sequenced recently on the HiSeq platform with longer read lengths and to a higher depth than previously. Using these data and sequencing data from the ends of large fragments (3, 6 and 40 kb), a completely de novo assembly is being generated, which will form the basis of the NOD/ShiLtJ draft genome sequence. Furthermore, the BAC end-sequences derived from the NOD mouse project will play an important role in scaffolding the new genome assembly and the finished BAC sequence in the Idd regions providing high quality finished genome sequence. As such, the new assembly has the potential to give a more complete overview of the NOD mouse genome.
Annotation
The average number of loci per Mb in the C57BL/6J reference genome using Ensembl database version 70.38, assembly version GRCm38 was calculated at 7.7 for protein coding genes and 11.1 for all genes. The average number of loci per Mb in the NOD Idd regions is 12.9 coding genes and 23 for all genes, which suggests that the Idd regions are typically more gene dense than the genome average. Similarly, the average genomic span for loci in C57BL/6J was calculated at 44 542 bp for protein-coding genes and 28 816 bp for all biotypes. The average genomic span for loci in the Idd regions is 37 028 bp for protein-coding genes and 23 352 bp for all biotypes, suggesting that genes typically found in Idd regions have a smaller than average genomic span. Most of the Idd regions appear to show close homology, with a similar number of genes present between C57BL/6J and NOD, apart from Idd6.AM and Idd9.2, which are regions with considerable structural variation.
To investigate gene expression differences between the two mice, next-generation-derived RNA-seq data can be aligned and viewed in Vega. This provides a useful way of investigating the transcriptional activity of genes that are not located within the finished NOD BAC sequences, allowing identification of splicing variation, potential differential gene expression and non-coding RNAs between the NOD mouse and the C57BL/6J reference mouse. Furthermore, this feature has also allowed the verification and confirmation of existing annotation (Figures 5 and 6).
Gene Bhlhe41 (yellow box) in the Idd6.1+2 region from GRCm38 C57BL/6J reference does not have a homolog annotated in NOD owing to a sequence gap (orange box). It is therefore not possible to be confident whether this gene is present and expressed in NOD mouse.
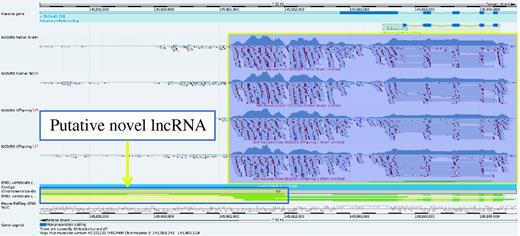
A higher resolution view of gene Bhlhe41 taken from the Vega genome browser. RNA-Seq data from NOD has been uploaded into the browser and aligned to the GRCm38 C57BL/6J reference. This shows that the gene is clearly expressed in the NOD mouse. On closer inspection, it would appear that there may be evidence of a 3′ overlapping non-coding RNA locus supported by three mouse mRNAs from AK032333.1, AK040945.1 and AK079251.1 as illustrated by the yellow box with the blue outline. The ability to upload RNA-seq data provides a way to investigate gene expression for sequences not yet represented in the NOD Idd regions and could also prove useful in observing differential intergenerational gene expression.
Variation
The average variation rate in the annotated NOD Idd regions that resulted from our BAC-based sequencing was ∼22% greater than the variation rate for the same regions calculated using the NOD/ShiLtJ sequence of the MGP. This is not completely unexpected as we were able to call SNPs in regions that were inaccessible for that project. When the authors calibrated their SNP-calling pipeline using the NOD/ShiLtJ BAC sequences presented in this study as a reference, they found that the density of SNPs in the NOD/ShiLtJ BAC sequence was 2.78-fold higher in inaccessible regions (32).
The Idd region variation rate was found to be 2.3 times higher (or ∼1.9 times higher according to the MGP data) than the mean NOD genome variation rate inferred from the NOD/ShiLtJ genome sequence. This likely reflects the fact that positive selection for functional variation in immune genes is beneficial to the species in regard to host defense (40), and most Idd genes are likely to be immune genes that function in various aspects of disease pathogenesis. In addition, inbred strains of laboratory mice have inherited a mosaic of haplotype blocks with extremely high SNP rates (40 SNPs per 10 kb) that represent ancient divergence within Mus musculus species, making it likely that functional variants of immune genes and their surrounding DNA have evolved separately for hundreds of thousands of years (41).
We have identified consequences of SNPs that affect protein-coding genes for regions that have not previously had published sequence data (Idd5.3 and Idd5.4, Idd6.1 and Idd6.2, Idd4.2Q and Idd16). Looking specifically for non-synonymous SNPs and variations that result in codon deletions or insertions, as such variation would be most likely to affect protein function, we found 49 affected loci. This included identification of sequence polymorphisms in two previously identified candidate genes, Lrmp and Bcat1, associated with Idd6.2 (42). Data generated from this resource have already contributed towards producing some important results for a number of Idd regions. Five genes have been identified in the Idd4.1 region (Alox15, Alox12e, Psmb6, Pld2 and Cxcl16) as being good candidates for the effects of this region (36). Sequence analysis has also identified likely causative SNPs in Idd5.1 (43), Idd9.3 (44), Idd10 (11) (45) and Idd18.1 (12). Other regions have revealed much greater sequence differences as is apparent in Idd6.AM (35). This region contains a gene cluster of Ly49 and human killer cell immunoglobulin-like receptors genes, which are known to be involved in autoimmune disease. The NOD mouse appears to be expanded with respect to C57BL/6J, having the largest known mouse Ly49 haplotype, variation that continues to confound next-generation sequencing and assembly techniques.
It is clear that traditionally derived sequencing and manually generated annotation have played an essential role in helping to identify sequence variation in important Idd candidate disease regions. Although most of the Idd regions appear to be gene rich, regions that are less gene dense could be candidates for investigating the effects of long-distance gene regulation or other mechanisms (2). Furthermore, much of the analysis that has been carried out for the Idd regions has focused primarily on protein-coding genes. However, it is becoming increasingly clear that lncRNAs have an important role to play in the regulation of gene expression, such as assembling chromatin-modifying complexes (46). Thus, sequence differences that might be identified between strains may affect lncRNA secondary structure and consequently their function. Knockout mouse projects such as the European Conditional Mouse Mutagenesis Program (EUCOMM) could in future investigate phenotypic differences between the C57BL/6J and NOD strains further to help elucidate factors influencing T1D (47). Current knockout mouse resources could be used for non-isogenic targeting of NOD mouse strains. Where this is not possible, the NOD BAC libraries could be used for direct targeting of NOD mouse genes. As T1D susceptibility loci appear to be shared with other immune disorders such as rheumatoid arthritis and Grave’s disease, suggesting shared aetiologies (48), the study of T1D genetics may provide a greater understanding of other autoimmune diseases.
Materials and Methods
Mapping, sequencing and finishing
BAC end-sequences from the DIL and the CHORI-29 library were mapped to the MGSCv3 C57BL/6J reference mouse build in Ensembl (15). In the regions of interest, a series of minimally overlapping tile paths of BACs was selected. Candidate BAC clones were analysed using HindIII restriction fingerprinting and assembled into contigs in FPC (49). Each BAC had a subclone library prepared, which was sequenced using T7 and SP6 primers on the vector with AB Big Dye Terminator Mix v3.1™ and the data analysed on AB 3730 automated sequencing instruments at WTSI. These data were assembled and subjected to automated primer walking, before re-assembly using PHRAP (P Green) and then passed into directed manual finishing for completion to phase 3 (50), where the estimated error rate is less than 1/100 000 (33). At the same time, as the NOD sequence was produced, the fidelity of the corresponding sequence in the C57BL/6J mouse was checked and assembly errors corrected where possible in conjunction with the GRC. Sequence progress was monitored via the NOD mouse website that was constructed for this purpose. The finished BAC sequences in this article have been submitted to the INSDC via the ENA at the European Bioinformatics Institute (EBI) (51). See Supplementary Data 1 for accession numbers. Numbers of reads performed for sequencing and finishing are also available here.
Annotation
Finished mouse clones were subjected to automated analysis for similarity searches and ab initio gene predictions in an extended Ensembl analysis pipeline system (52), which is stored in a MySQL database. Interspersed repeats were identified and classified using RepeatMasker (53) and tandem repeats with TRF (54). Manually annotated sequences have been generated using in-house developed software (55) in accordance with the manual annotation guidelines (56). Designation of biotypes (coding, non-coding and pseudogenes) and gene structures was carried out as defined by the standards in GENCODE (57). Known loci that are represented in the mouse genome database (58), RefSeq (59) or UniProt (60) were tagged as ‘known’ in C57BL/6J and NOD. Genes are categorized not only at the gene level but also at the transcript level, definitions of which can be found in Vega (61). Gene structures were transferred using exonerate’s (62) cdna2genome model to align transcripts between the C57BL/6J and NOD mouse strains where clear homology existed and verified. Where clear homologs could not be identified, the gene models were built independently and named after the NOD BAC clone they aligned to (see Figure 7). See Supplementary Data 2 for annotation for each Idd region.
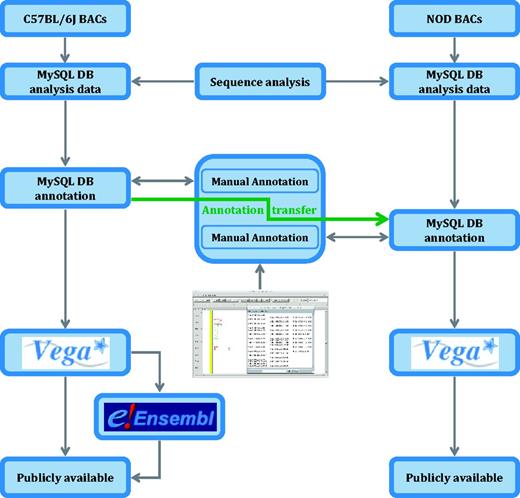
Analysis pipeline for the NOD mouse project. C57BL/6J genomic sequence in Idd regions is annotated before an annotation transfer using exonerate, shown here by the orange arrow. Transcript objects are then manually inspected again in the NOD mouse and further manual annotation carried out where appropriate. Unlike the C57BL/6J annotation, the NOD mouse annotation is only available in Vega.
Variation analysis
Nucleotide sequences of homologous genes in the C57BL/6J mouse and NOD mouse regions were aligned with MAFFT v6.857, and variants were derived from the alignments using an ‘ad-hoc’ Perl script. Variants overlapping simple and tandem repeats in the mouse genome sequence according to the Ensembl database v70 (‘dust’ and ‘TRF’ analyses) were filtered out. Variant consequences were obtained with SnpEff v3.1h (63) based on annotations extracted from the human and vertebrate analysis and annotation internal database taking the GRCm38 C57BL/6J mouse as the reference genome. For the comparison with the MGP derived NOD/ShiLtJ sequence, the confidently mapped genome positions were obtained using SAMtools mpileup (64) with minimum mapping quality of 30, minimum base quality of 30 and read length between 10 and 200. See Supplementary Data 3 for details. The SNPs identified in this study have been deposited in dbSNP under the WTSI_NOD_MOUSE handle.
RNA-Seq alignments in Vega
NOD BAM files were downloaded from the ENA (25) (NOD_Offspring1Brain—accession ERR033017, NOD_Offspring2Brain—accession ERR032989, NOD_FatherBrain—accession ERR032990, NOD_MotherBrain—accession ERR032991), mapped to the GRCm38 build and finished NOD contigs using default TopHat settings (65), uploaded to the Sanger NGS server and attached to the Vega genome browser using the ‘Attach remote file’ function.
Acknowledgements
The authors thank Thomas Keane for his advice and help with the variation calling and the teams in mapping, sequence production, finishing, annotation and analysis for their contributions.
Funding
This research was conducted as part of the Immune Tolerance Network (ITN), via contract AI 15416, which is jointly funded by the National Institute of Allergy and Infectious Diseases (NIAID), the National Institute of Diabetes, Digestive, and Kidney Disorders (NIDDK), both part of the National Institutes of Health and the Juvenile Diabetes Research Foundation (JDRF). L.S.W. was supported by Wellcome Trust (096388), Juvenile Diabetes Research Foundation International (9-2011-253), and the Cambridge Institute for Medical Research is in receipt of Wellcome Trust Strategic Award (100140). The project was also supported by the Wellcome Trust Sanger Institute. Funding for open access charge: The Wellcome Trust.
Conflict of interest. None declared.
References
Author notes
Citation details: Steward,C.A., Gonzalez,J.M., Trevanion,S., et al. The non-obese diabetic mouse sequence, annotation and variation resource: an aid for investigating type 1 diabetes. Database (2013) Vol. 2013: article ID bat032; doi:10.1093/database/bat032
