


Abstract
Our database tool, called Real-Time Engine for Expression Quantitative Trait Loci Analyses (RTeQTL), can efficiently provide eQTL association results that are not available in existing eQTL databases browsers. These functions include (i) single SNP (single-nucleotide polymorphism) and (ii) two-SNP conditional eQTL effects on gene expression regardless of the magnitude of P -values. The database is based on lymphoblastoid cell lines from >900 samples with global gene expression and genome-wide genotyped and imputed SNP data. The detailed result for any pairs of gene and SNPs can be efficiently computed and browsed online, as well as downloaded in batch mode. This is the only tool that can assess the independent effect of a disease- or trait-associated SNP on gene expression conditioning on other SNPs of interest, such as the top eQTL of the same gene. It is also useful to identify eQTLs for candidate genes, which are often missed in existing eQTL browsers, which only store results with genome-wide significant P -value. Additional analyses stratifying by gender can also be easily achieved by this tool.
Database URL:http://eqtl.rc.fas.harvard.edu/
Introduction
The ability to interrogate and study the genetics of functional phenotypes that are intermediate between a DNA variant and a disease phenotype of interest can point to the true biological mechanism, critical to disease etiology. Gene expression is one of these key intermediate functional phenotypes ( 1–3 ). Numerous studies illuminate significant genetic variation, within and between human populations that affects gene expression levels, and by doing so may underlie phenotypic variation (e.g., 4, 5–8).
Existing databases (such as eqtl.uchicago.edu/cgi- bin/ gbrowse/eqtl/, www.sanger.ac.uk/resources/software/ genevar/ , www. scandb.org/newinterface/about.html , www. ncbi.nlm.nih. gov/projects/gap/eqtl/index.cgi , www.hsph.harvard.edu/li ming-liang/software/eqtl/ , www.sph.umich.edu/csg/liang/im p u tation/ , www.sph.umich.edu/csg/liang/asthma/ ) of expression quantitative trait loci (eQTLs) based on lymphoblastoid cell lines (LCL) and other tissues ( 4 , 6–20 ) have helped interpret findings from genome-wide association studies (GWAS) for complex diseases and traits, including childhood asthma, Crohn’s disease, Type 2 diabetes, circulating resistin levels, Graves’ disease, human height, body mass index, waist-hip ratio, osteoporosis-related traits, skin cancer, esophageal squamous-cell carcinoma and human red blood cell. To the best of our knowledge, all public available eQTL browsing tools based on LCL or other tissues only provide significant eQTLs based on stringent GWAS threshold, and all results were based on single variant analysis. However, after identification of disease or trait-associated eQTL using existing eQTL browsers, it is often required to assess whether a disease-associated variant has an independent effect on gene expression after conditioning on the peak eQTL for the same gene ( 21–24 ). For candidate gene study, it is also desirable to report eQTLs that pass a less stringent significance cutoff because of the far lower number of multiple tests compared with GWAS of gene expression traits, where billions of hypotheses were tested for cis (local) and trans (distant) eQTLs. All of these analyses are not feasible for existing eQTL browsers without accessing the raw genotype data, which are usually not publicly available. And it is computationally impossible to precompute such analyses for all single-nucleotide polymorphisms (SNPs) and genes on the genome and store the results in any eQTL browser. As human diseases and traits depict sex-specific genetic architecture ( 25 ), a sex-specific eQTL assessment would provide unique insight into the etiology of the disease or trait of interest ( 26 ). This information is not possible to achieve from existing eQTL databases.
Here, we developed an online database tool that can do all above eQTL analysis in real time without the need to share raw genetic and gene expression data. Specifically, this tool can test for association between any gene expression and any two SNPs chosen by the user. The analyses can be done using the full samples or stratified by male and/or female. Single variant analyses for any pair of gene-SNP are also provided. All results are output to web table format and can be downloaded in batch mode.
Description
Real-Time Engine for Expression Quantitative Trait Loci Analyses (RTeQTL) is a web-based database tool, and hence all computation is carried out at the server side. A user-friendly interface is provided to facilitate easy access and interpretation of results
Data
Gene expression in LCL was characterized in two independent data sets, one sample of 405 siblings using Affymetrix HG U133 Plus 2.0 chips (>54 000 transcription probesets, Medical Research Council asthma study family panel (MRCA) data set ( 4 ) and the other sample of 550 siblings using Illumina Human6 V1 array (>47 000 transcription probes, Medical Research Council eczema study family panel (MRCE) data set). All samples include Caucasians of British descendant. Among these individuals, 928 were also genotyped at >300 000 SNPs using the Illumina HumanHap300 arrays, with additional genotypes for 2 million SNPs in the HapMap Project filled in using imputation. These two data sets together identified genome-wide significant cis and trans eQTLs for 14 177 genes ( 27 ). We will impute the latest version of 1000 Genome Project variants whenever available and update the Web site.
Microarray hybridization and normalization
The peripheral blood lymphocytes were transformed by Epstein-Barr virus, and then cultured in 500-ml roller. The cell lines were collected when the cell lines reached the log phase followed by storing at –80°C until use. RNA was extracted from the samples stored at −80°C in batches using the RNeasy Maxi Kit, after which the quality and the quantity of RNA were evaluated. In all, 10 mg of RNA was used to synthesize cDNA, which was used as a template in vitro transcription according to the manufacturer’s instruction. Then 15 mg of labeled, fragmented cRNA was hybridized to Affymetrix U133 Plus 2.0 GeneChips and Illumina Human6 V1 array for MRCA and MRCE data sets, respectively ( 27 ).The MRCA expression data were normalized using the robust multi-array average package to remove any technical or spurious background variation. The MRCE expression data were normalized using quantile normalization based on expression values from GenomeStudio.
Whole-genome genotyping and imputation
All DNA samples were subjected to stringent quality control to check for fragmentation and amplification. We adopted 20 ml of DNA at a concentration of 50 ng/ml for each array. Whole-genome genotyping was performed according to manufacturers’ protocol using the Illumina HumanHap300 Genotyping BeadChip in a BeadLab with full automation, and the process was traced in real time. We excluded SNPs with call rate <95%, Hardy–Weinberg equilibrium P < 10 −6 and MAF <2%. We imputed genotypes from all HapMap2 SNPs using Markov chain haplotyping (MaCH) package ( 28 ). All imputed SNPs with low imputation quality score (Rsquare<0.3) were excluded from the database.
Statistical analysis model
User input
The user chooses the gene and SNPs in analysis. The probe name for either the Affymetrix or Illumina platform can be chosen by specifying gene names and then adding them to the input box for probes. For analyses involving multiple pairs of gene and SNPs (batch mode), the list of SNP rs names and probe names can be copied and pasted into the corresponding input boxes. There are two cases for SNP columns: (i) when single SNP analysis is desirable, the user inputs the SNP rs name into ‘SNP1’ column and ‘-’ (short dash) in the ‘SNP2’ column. (ii) When two SNPs analyses are desirable, the user inputs the SNP1 rs name into ‘SNP1’ column and SNP2 rs name in the ‘SNP2’ column. When analyses stratified by sex are needed, the user can choose appropriate data sets in the drop-down menu named ‘Stratify by gender’, where ‘Male & Female’ means analysis using full samples without considering SNP*gender interaction effect, ‘Male” or “Female” will only output results for male or female data set, respectively, and ‘Gender Specific’ will perform analysis in male and female separately but output both results. Sanity check for input names will also be performed. We provide a manual on our website and readers will find detailed description on how to use our database http://eqtl.rc.fas.harvard.edu/mrce/static/RTeQTL_manual_20130623.pdf . For example, the input setting shown in Figure 1 will return eQTL results for the following three models:
Expression of 211698_at = rs6809559 + rs1538187 (Two-SNP analysis)
Expression of 121_at = rs1538187 + rs6809559 (Two-SNP analysis)
Expression of 1007_s_at = rs6809559 (Single-SNP analysis)
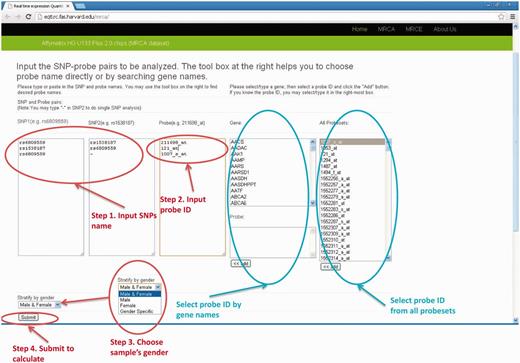
The input web page (MRCA example). There are four steps to submit a query. (1) input SNP1 and SNP2 names (2) input probe ID (3) select sample's gender (4) click the “Submit” button.
Results output
Results table will be output on the web page and can be downloaded to desktop computer by clicking the link ‘Download the table as csv file’ on top of the result table. Each row corresponds to a result for each pair of gene and SNPs. Full details for regression results are available, including effect size, standard error, test statistics, P -value as well as gene annotation of the expression probe and SNPs (chromosomal position, allele label, allele frequency, MaCH imputation quality score, Rsq- see Table 1 ) and the column to indicate the samples used for analysis. If we compute single SNP, the corresponding outputs of the SNP2 are ‘NA’. If the input SNP or probe name could not be found in our data files, there will be some notes in the last row of the output table. See Figure 2 for an output example.
Headers and description of the online output table
| Column order | Name | Description |
|---|---|---|
| 1 | Effect | Effect size from linear mixed model. The amount of increase/decrease expression by one copy of the Allele 1 in the unit of one standard deviation |
| 2 | SE | Standard error of |
| 3 | DF | Degrees of freedom of the test |
| 4 | t -value | /SD( ) |
| 5 | P -value | The probability of |
| 6 | AL1/2 | The allele1/2 label |
| 7 | FREQ1 | Frequency for Allele1 |
| 8 | Chr | Chromosome |
| 9 | Position | Position on chromosome (NCBI 36) |
| 10 | Rsq | MaCH imputation quality score, which estimates the squared correlation between imputed and true allele counts |
| 11 | Gender | Sample’s gender when analysis stratified by gender |
This table provides the header names and description of the columns of the result table for online association analyses output by the RTeQTL website.
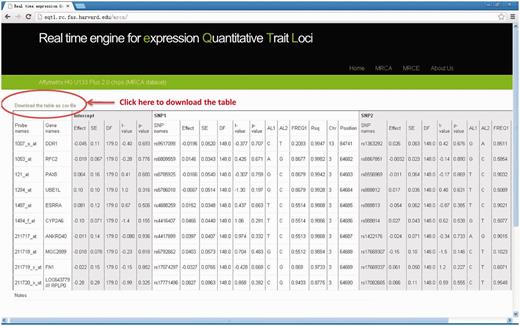
The output web page (MRCA example). Full details for regression results are available on output webpage and results table can be downloaded to desktop computer by clicking the link “Download the table as csv file”.
Implementation
Python and HTML languages are used to control workflow and provide efficient access to the data. R function is used to compute the linear mixed model. Original SNP data and expression data were deidentified and stored as binary format. We built efficient index so that specific SNP and expression data can be retrieved in real time. Specifically, one design feature of this engine is that we transform the huge text files of SNPs and gene expression data into multiple smaller binary files to accelerate I/O reading speed. The other feature of this engine is that we used hierarchical index so that the SNPs data corresponding to the SNPs name input from web page can be quickly located and acquired in the binary files. The analysis for 100 gene-SNPs pairs takes only 20s.
Examples
Our eQTL database has been applied to real biological data. The first example is for analysis stratified by gender ( 26 ). A genome-wide search for sexually dimorphic associations with height, weight, body mass index, waist circumference, hip circumference and waist-hip ratio was conducted and results demonstrate the value of sex-stratified GWAS to unravel sexually dimorphic genetic underpinning complex traits. The other example is for eQTL conditional analysis ( 21–24 ). The conditional analyses were performed for all expression data, except for cortical tissue, by conditioning the trait-associated SNP on the most significant cis -associated SNP for that particular gene transcript and vice versa.
Commitment to future updates
We will impute genetic variants from the 1000 Genomes panel (phase 1) and update the database. Each following release of 1000G variants will be imputed and incorporated to the database.
Conclusion and Discussion
We developed an efficient web-based database tool for eQTL analysis of any gene and SNPs available. Both single-SNP and two-SNP analyses can be performed, as well as analyses stratified by males and females. The computational result for any pairs of gene and SNPs can be shown online and downloaded in comma separate values (CSV) format. Controlling for multiple testing is important even for candidate gene study. The number of tests to control is determined by the actual number of SNP-gene pairs queried from the Web site, instead of the number of available SNPs around the locus of interest. As a general guideline to provide a sense of significance level at genome-wide average, we note that we previously estimated that 5% false discovery rate (FDR) accounting for all cis and trans pairs corresponded to P < 1.02 × 10 −7 (1% FDR corresponding to P < 1.62 × 10 −8 ) ( 27 ). For cis eQTL defined as SNP and probe within 1 Mb of each other, the 1% FDR corresponded to P < 6.83 × 10 −5 .
To the best of our knowledge, it is the only online tool that can evaluate the independent effect of a disease- or trait-associated SNP on gene expression conditioning on other SNPs of interest, such as the top eQTL of the same gene. We commit to update the web tool regularly by incorporating more gene expression data sets and imputing the latest panel of variants from the 1000 Genomes Project when available.
Acknowledgements
We appreciate Drs. William Cookson and Miriam Moffatt for their helpful discussion to improve this database tool.
Funding
This work was supported by China Postdoctoral Science Foundation (2014M551084), the Fundamental Research Funds for the Central Universities (3132014306), Young Foundation of Dalian Maritime University (2011QN119) and NIH (R01 GM104411). Funding for open access charge: NIH (R01 GM104411).
Conflict of interest. None declared.
References
Author notes
† These authors contributed equally to this work.
Citation details: Ma,B., Huang,J. and Liang,L. RTeQTL: real-time online engine for expression quantitative trait loci analyses. Database (2014) Vol. 2014: article ID bau066; doi:10.1093/database/bau066
