


Abstract
The publicly available online database MelGene provides a comprehensive, regularly updated, collection of data from genetic association studies in cutaneous melanoma (CM), including random-effects meta-analysis results of all eligible polymorphisms. The updated database version includes data from 192 publications with information on 1114 significantly associated polymorphisms across 280 genes, along with new front-end and back-end capabilities. Various types of relationships between data are calculated and visualized as networks. We constructed 13 different networks containing the polymorphisms and the genes included in MelGene . We explored the derived network representations under the following questions: (i) are there nodes that deserve consideration regarding their network connectivity characteristics? (ii) What is the relation of either the genome-wide or nominally significant CM polymorphisms/genes with the ones highlighted by the network representation? We show that our network approach using the MelGene data reveals connections between statistically significant genes/ polymorphisms and other genes/polymorphisms acting as ‘hubs’ in the reconstructed networks. To the best of our knowledge, this is the first database containing data from a comprehensive field synopsis and systematic meta-analyses of genetic polymorphisms in CM that provides user-friendly tools for in-depth molecular network visualization and exploration. The proposed network connections highlight potentially new loci requiring further investigation of their relation to melanoma risk.
Database URL: http://www.melgene.org .
Introduction
Although a small fraction of mainly familial patients with cutaneous melanoma (CM) carry highly penetrant gene mutations ( 1–5 ), i.e. mutations in CDKN2A and CDK4 , the more common sporadic form of CM is likely caused by the complex interplay of environmental and multiple genetic risk factors that exert moderate risk effects ( 1 ). Up to now, an increasing number of genetic association studies including candidate-gene and genome-wide association studies (GWAS) have been published that report on novel CM risk genes or attempt to validate previously reported genetic risk factors in CM ( 1 ). Owing to the enormous amount of partly contradictory information derived from those studies, the evaluation and interpretation of the genetic predisposition of CM is not a trivial task ( 6 ). To effectively collect and analyze all available information related to CM, we have implemented an online database named MelGene that provides a systematic and in-depth qualitative and quantitative catalog of genetic association studies in CM. Our database includes random-effects meta- analysis results of eligible polymorphisms that highlight the most compelling CM risk loci ( 7 ).
We conducted a systematic update in the MelGene database by including detailed summaries of all recently published association studies and by performing meta- analyses in all eligible polymorphisms that have been investigated in multiple studies to provide a summary effect for the association of each single-nucleotide polymorphism (SNP) to CM risk. The epidemiological validity of nominally significant meta-analysis results was assessed using the ‘Venice’ criteria suggested by the Human Genome Epidemiology Network ( 8 ). In this study, we present the new design of the front end and the back end of the database, providing the user with a more functional interface, easy-to-handle queries and embedded tools that facilitate the visualization and the exploration of the molecular relationship networks of putative genetic risk factors of CM. MelGene database provides a systematic and comprehensive overview of genetic association studies (both candidate-gene and GWAS) focusing exclusively on CM. Besides the embedded tools for data searching using keywords, MelGene database provides tools for automated meta- analysis of the collected data and allows for construction of networks using the available polymorphisms in the database. These features make MelGene database unique compared with databases such as GWAScentral ( http://www.gwascentral.org/ ) or ‘The catalogue of Published Genome-Wide Association studies’ from the National Human Genome Research Institute that act as a compilation of summary-level findings and allow for searches between loci derived from GWA studies for various outcomes ( http://www.genome.gov/gwastudies/ ).
Material and methods
Search strategy, data collection and meta-analysis
For the continuous curation of the MelGene database, we performed systematic literature searches for peer-reviewed genetic association studies on CM using PubMed ( http://www.ncbi.nlm.nih.gov/pubmed ), the Human Genome and Epidemiology Network Navigator ( http://hugenavigator.net ) and the Melanoma Molecular Maps Project ( http://www.mmmp.org/MMMP ). The last search was conducted on 31 August 2013. The search strategy has been described in detail elsewhere ( 7 ). The current version of MelGene includes 192 publications that fulfilled our inclusion criteria [outlined in ref. ( 7 )] and that report on 1114 polymorphisms across 280 genes. For each biallelic polymorphism included in the database with data of at least four independent case-control data sets (n = 79), a random- effects meta-analysis was calculated based on the DerSimonian and Laird model ( 7 ). In addition, between-study heterogeneity was quantified by the I 2 metric. Forest plots of the respective meta-analysis results were created using the ‘ metafor ’ package ( 9 ) in the R programming language ( http://www.r-project.org/ ). Users are able to download those forest plots in high resolution ( Figure 1 B and C). The database curation is supported by an experienced team, which includes clinicians, biologists, bioinformaticians, biostatisticians and genetic epidemiologists.
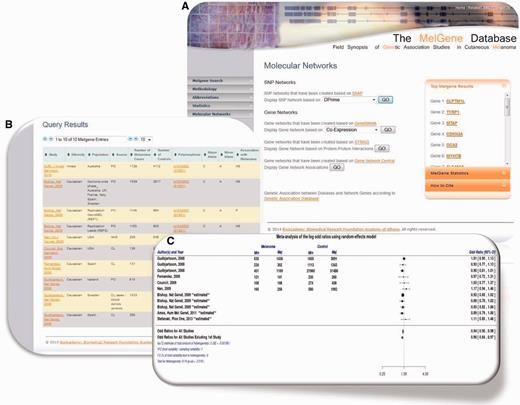
( A ) Updated MelGene database search engine. Users are able to retrieve information available on MelGene based on keywords such as the gene name, polymorphism name, chromosome, first author of a publication, year of publication, ethnicity and the country of origin of study populations. ( B ) Polymorphism overview page and meta-analysis of polymorphism rs1042602 as an example. All publications that were included in MelGene and assessed rs1042602 in their data sets are listed in a sortable interactive table, and cross-links to the corresponding publications indexed in PubMed are provided in the database. ( C ) Forest plot of rs1042602 displays study-specific results as well as the summary OR , 95% CI and heterogeneity estimate.
Database construction
The database scheme was created using MySQL (version 5.5.27, http://www.mysql.com/ ) and comprises the following fields: entry id, gene symbol, chromosome, location, study name consisting of first author name and year of publication, ethnicity, population and polymorphism name (where applicable, the official NCBI ’s rs identifiers have been used, http://www.ncbi.nlm.nih.gov/snp/ ). In addition, fields were also supplemented by the following information where available: number of melanoma cases, number of controls, significance assessment by the authors of each publication, the minor and the major allele name based on genetic data available in the respective publication, minor–minor, minor–major and major–major genotype counts per study population, the allele frequency in CM cases as well as in control subjects, the additive odds ratio ( OR ) and 95% confidence interval (CI) limits if provided in the respective publication.
Web application interface
The updated publicly available version of MelGene enables users to search the database based on a variety of parameters. More precisely, the database can be searched by gene name, polymorphism name, chromosome, name of the first author of a publication, the year of publication, the minimal number of cases per population, the geographical origin of study populations and by using a free text keyword search field. The updated Web-application search engine was implemented using html , PHP ( http://php.net/ ) and MySQL ( http://www.mysql.com/ ) queries ( Figure 1 A).
Moreover, for each polymorphism included in the MelGene , the updated database version provides links to several other genetic databases, and thus facilitates the retrieval of additional information on specific polymorphisms and genes of interest, i.e. NCBI ’s dbSNP ( http://www.ncbi.nlm.nih.gov/projects/SNP/ ), the International HapMap project’s database ( http://hapmap.ncbi.nlm.nih.gov/ ), the Ensembl browser ( www.ensembl.org ), the SNPedia Web site ( http://www.snpedia.com ) and GWAS Central ( https://www.gwascentral.org/ ).
Embedded tools to visualize and explore molecular relationship networks
Pairs of polymorphisms and/or their corresponding genes that have been included in MelGene can be assessed for 13 different types of relationship. Each type of relationship drives to a different network representation where the nodes are either polymorphisms or genes and the edges represent the existence and the strength of the relationship between two nodes. Network representations of the MelGene data were created and uploaded on the MelGene Web server. The software used for the construction of each network and the type of the networks are provided in Table 1 .
Detailed list of all generated networks that are available in MelGene
| AA | Software used to generate the network | Node type | Edge type |
|---|---|---|---|
| 1 | GeneMANIA | Gene | Co-expression |
| 2 | GeneMANIA | Gene | Protein–protein interactions |
| 3 | GeneMANIA | Gene | Genetic interaction |
| 4 | GeneMANIA | Gene | Shared protein domain |
| 5 | GeneMANIA | Gene | Co-localization |
| 6 | GeneMANIA | Gene | Pathway |
| 7 | STRING | Gene | Protein–protein interaction |
| 8 | SABiosciences Gene Network Central | Gene | Reported or predicted as CM (Literature) |
| 9 | SNAP | Polymorphism | Recombination rate |
| 10 | SNAP | Polymorphism | Genetic map distance |
| 11 | SNAP | Polymorphism | Genetic map position |
| 12 | SNAP | Polymorphism | DPrime |
| 13 | SNAP | Polymorphism | RSquared |
The first column indicates the software used to generate each molecular relationship network. The second and third columns describe the type of nodes and associations (weights), respectively. GeneMANIA URL : http://www.genemania.org/ ; STRING URL : http://string-db.org/ ; SABiosciences Gene Network Central URL : http://www.sabiosciences.com/genenetwork/genenetworkcentral.php ; SNAP URL : http://www.broadinstitute.org/mpg/snap/ .
The list of all 280 genes included in MelGene has been used as input to Cytoscape ( http://www.cytoscape.org/ ) ( 10 ), an open-source software for integration, visualization and analysis of biological networks. Specifically, the GeneMANIA plug-in ( http://www.genemania.org/ ) ( 11 ) of Cytoscape has been used. This plug-in retrieves a list of genes that are related to the input genes based on a large set of functional data, including (i) co-expression, where two genes are linked if their expression levels are similar across conditions in a gene expression study, (ii) protein–protein interactions, (iii) genetic interaction, where two genes are functionally linked if perturbations of one gene has an impact to the second, (iv) shared protein domains, where two genes are linked if they have the same protein domain, (v) co-localization, where genes are linked if they are expressed in the same tissue and (vi) pathways, where two genes are linked if they are part of the same pathway [see ( 11 ) for more details]. With the use of GeneMANIA , new members of a pathway or a complex interaction can be highlighted.
Moreover, two additional relationship networks have been constructed. The first network was a protein–protein interaction network created by means of the STRING database ( http://string-db.org/ ) ( 12 ), whereas a second network was created based on the question of whether the input genes have been reported or predicted as being involved in CM pathophysiology in the literature, according to SABiosciences Gene Network Central ( 13 ).
In addition, all 1114 polymorphisms included in MelGene were submitted to SNAP ( http://www.broad institute.org/mpg/snap/ ) ( 14 ), yielding another six sets of networks. SNAP provides pair-wise SNP’s calculations of input against the ‘1000 Genome Pilot 1’ SNP data set based on phased genotype data from the International HapMap Project ( http://hapmap.ncbi.nlm.nih.gov/ ) ( 15 ). Using the SNAP tool with the 1114 SNPs, five additional molecular relationship networks were created using as network relationship measure (i) the recombination rate in centimorgans per million bases, (ii) the genetic map distance (that is, the distance from the query SNP to the proxy SNP in centimorgans), (iii) the genetic map position (that is, the position of the SNP on the genetic map for this chromosome in centimorgans), (iv) D’ [measure of linkage disequilibrium ( LD ) normalized to allele frequency] and (v) the r2 correlation coefficient [see ( 14 ) for more details].
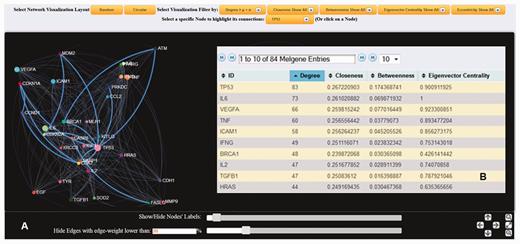
Both SNP and gene interaction network visualization tools were implemented in MelGene by means of the jQuery ( http://jquery.com/ ) and ‘ sigma.js ’ ( http://sigmajs.org/ ) JavaScript libraries. Figure 2 shows an example of an interaction network based on genes’ co-expression properties. Networks can be created on a random or circular layout. The node’s size is proportional to the number of first neighbors that are interconnected to the specific node. A larger size signifies a larger number of interconnections. Users of MelGene can locate and highlight a specific node interactively, either by using a drop-down box or by clicking on the node. The color and the weight of the edge between two interconnected nodes are an indicator of how closely these two nodes are related. White color corresponds to low, whereas cyan to high linkage weight. In addition, when a node is selected, node-specific network features [see ( 16 ) for detailed description] of their first neighbors are also provided, including the degree (i.e. number of adjacent edges), closeness (which measures how many steps are required to access every other node from a given node), betweenness (i.e. the shortest path from one node to another), and eigenvector centrality (a natural extension of degree centrality measuring the importance of a node if it is linked to by other important nodes). All the aforementioned features were apriori calculated by means of the ‘ igraph ’ ( http://cran.r-project.org/web/packages/igraph/ ) ( 16 ) R package tool ( http://www.r-project.org/ ) applied to each created relationship network. For each network, users are also able to apply network visualization filtering based on the mean value and the standard deviation calculated by the entire selected feature vector. This filtering can be performed either locally by selecting a node or globally to the entire network and can reveal ‘hub’ nodes in a more robust approach ( Figure 3 ).
( A ) Dynamic gene interaction network based on protein–protein interactions using the gene TP53 as an example. First neighborhood interactions of TP53 are highlighted against the entire protein–protein interaction network. In the present example, edges (interconnections) with weight <20% of the maximum weight value were omitted, and node (gene) labels with >10 interactions are displayed. ( B ) List of the calculated node-specific network features corresponding to node TP53 is provided.
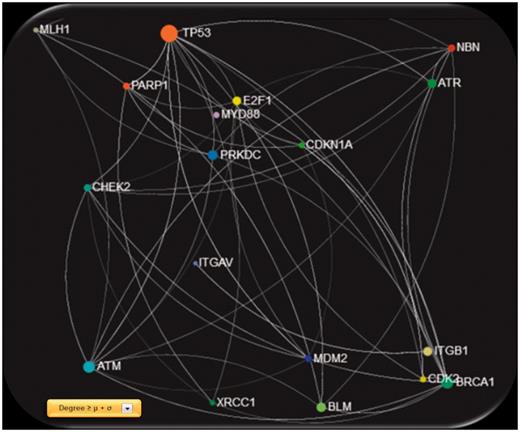
Screenshot of the gene network created using GeneMANIA physical interactions, filtered with degree ≥ μ + σ, were μ and σ are the mean value and standard deviation of the entire degree feature vector, respectively.
Results and discussion
After a comprehensive data collection and systematic meta-analyses of CM association studies in MelGene , 20 genes showed genome-wide significant ( P < 5 × 10 −8 ) evidence for association with CM risk ( MelGene top genes , Table 2 ). In addition, summary OR s and 95% CIs, heterogeneity as well as summary estimates on exclusion of the first published study were calculated and the respective plots have been made publicly available in the database. Moreover, the new network visualization tools developed in the updated MelGene database provides additional information about interconnections among genes or SNPs that may be indirectly related to CM. In the following result sections, we depict some genes and polymorphisms highlighted from the network-driven analyses that were performed in the MelGene environment.
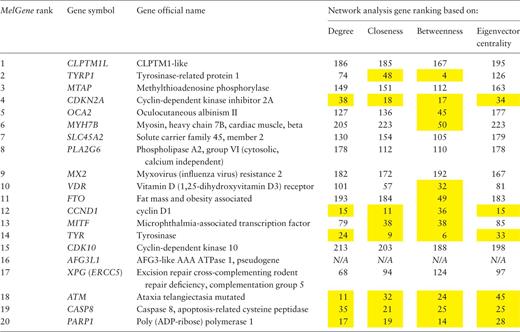
.Ranked list of the most significantly associated CM genes according to MelGene .
 |
|
Network features were calculated on the relationship network produced by the STRING platform. In the present example, we have performed gene ranking for each network feature (of note, the pseudogene AFG3L1 was not found in the STRING platform and thus excluded from this list). The genes that rank among the top 50 of the respective network features are highlighted in yellow.
.Ranked list of the most significantly associated CM genes according to MelGene .
|
|
Network features were calculated on the relationship network produced by the STRING platform. In the present example, we have performed gene ranking for each network feature (of note, the pseudogene AFG3L1 was not found in the STRING platform and thus excluded from this list). The genes that rank among the top 50 of the respective network features are highlighted in yellow.
The gene co-expression network reconstructed by the GeneMANIA plug-in revealed that the majority of MelGene top genes (18 of 20) are interconnected with at least one edge, presenting a high level of co-expression between these genes. In Figure 4 , we see the corresponding co-expression matrix for these genes.
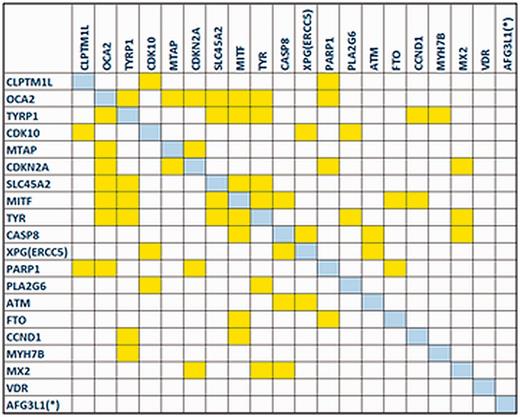
The co-expression matrix for the MelGene top genes that showed genome-wide significant ( P < 5x10 −8 ) evidence for association with CM risk.
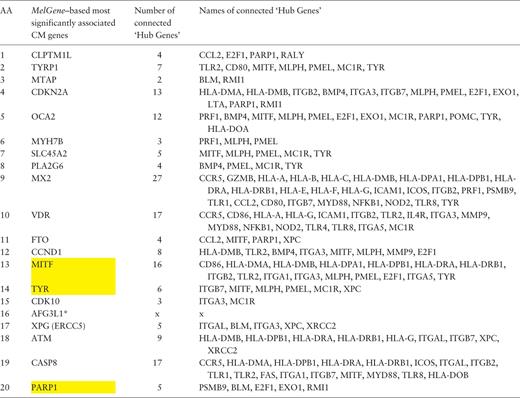
Furthermore, in the same gene co-expression network, we investigated which genes act as ‘hubs’ and assessed their relationship with the MelGene top genes . We calculated four network properties per node: degree, closeness, betweenness and eigenvector centrality. In the sequel, we calculated their average values (μ) and the corresponding standard deviations (σ). For each property, we considered as ‘hubs’ the genes that present a property value above μ + σ, and finally we merged the ‘hub genes’ from the four properties in one list. Afterward, we examined whether genes from Table 2 are ‘hub genes’ or are they connected with other ‘hub genes’. We found that the genes MITF , TYR and PARP1 of Table 2 are ‘hub genes’ and that the genes CDKN2A , OCA2 , MX2 , VDR , MITF and CASP8 are interconnected with >10 ‘hub genes’ as shown in Table 3 .
Ranked list of the most significantly associated CM genes according to MelGene along with the number and the names of the interconnected ‘hub genes’ in the corresponding co-expression network
 |
|
Yellow highlighted are those genes that act also as ‘hubs’. * AFG3L1 is reported as pseudogene.
Ranked list of the most significantly associated CM genes according to MelGene along with the number and the names of the interconnected ‘hub genes’ in the corresponding co-expression network
|
|
Yellow highlighted are those genes that act also as ‘hubs’. * AFG3L1 is reported as pseudogene.
The current update of MelGene database includes 20 genes that showed genome-wide significant ( P < 5 × 10 −8 ) evidence for association with CM risk compared with 12 genes described in the previous field synopsis ( 7 ). Investigating the relationship between the previous and the current MelGene top gene list, we mapped the genes on the network constructed by GeneMANIA with all the available relationship types (co-expression, co-localization, genetic interactions, physical interactions, pathways and share protein domain). The fully connected (i.e. nodes without a connection are absent) subnetwork of these genes is shown in Figure 5 . The significant genes of the previous update are visualized with orange diamonds; the significant genes of the current field-synopsis are visualized in yellow whereas the genes required for a fully connected subnetwork are highlighted in blue ( TP53 , PMEL , ITGA7 and ITGA9 ; Figure 5 ).
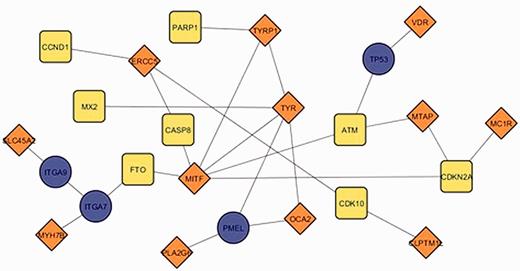
The fully connected subnetwork of the genes from two successive field synopses of MelGene that showed genome-wide significant evidence for association with CM risk. Orange, blue and yellow corresponding to the significant genes of the previous MelGene version, the significant genes of the current MelGene analysis and the genes required for a fully connected subnetwork, respectively.
We found that the genes TYRP1 , TYR , MITF and ERCC5 displayed in Figure 5 are ‘important connectors’ in the network as they interact with 3, 5, 6 and 3 ‘significant’ genes that were significant using random-effects meta- analysis. Investigating these genes further, we found that they have been implicated in CM in the literature and/or by several other databases. More specifically, p53 has been suggested to be a major player suppressing progression from nevi to melanoma ( 17 , 18 ). Aside from its role in pigmentation, PMEL (SILV) encodes antigenic epitopes that are recognized by multiple melanoma diagnostic antibodies including HMB-45, currently one of the most commonly used melanocytic markers for clinical melanoma diagnosis in humans ( 19 ). Furthermore, for PMEL , MalaCards, a database of human maladies and their annotations ( www.malacards.org ) ( 20 ), as well as the DISEASES database (Disease-gene associations mined from literature) developed by the University of Copenhagen ( http://diseases.jensenlab.org ) rank CM as the first disease related for PMEL . Finally, proteins encoded by ITGA7 and ITGA9 genes belong to the integrin alpha chain family. Changes in integrins expression have been reported during the malignant progression of many tumors, and much evidence exists implicating their involvement in CM metastasis ( 21 ). Malacards also implicates ITGA7 and ITGA9 in CM (eighth and third rank of gene-related diseases, respectively).
Another important gene in the co-expression network is MLANA . MLANA , a key network element, was found to be co-expressed with 8 ( TYRP1 , CDKN2A , OCA2 , SLC45A2 , PLA2G6 , MX2 , MITF and TYR ) from the 20 MelGene top genes of the current MelGene gene list. CM is ranking first among the diseases related to MLANA according to the MalaCards and DISEASES databases, but its role as a risk gene for CM in MelGene currently remains unclear due to lack of sufficient association data.
In addition, ITGB2 was found to act as a ‘hub gene’ by all centrality measures and is co-expressed with 5 ( CDKN2A , MX2 , VDR , MITF and CASP8 ) from the 20 MelGene top genes . Moreover, CM is ranking sixth among the diseases related to ITGB2 according to Malacards.
Finally, regarding HLA-A , CM is ranking third among the related diseases according to MalaCards and the DISEASES database. HLA-A is co-expressed with 2 ( MX2 and VDR ) of the 20 MelGene top genes and it acts as a ‘hub gene’ according to three important centrality metrics (Degree, Closeness and Eigenvector centrality).
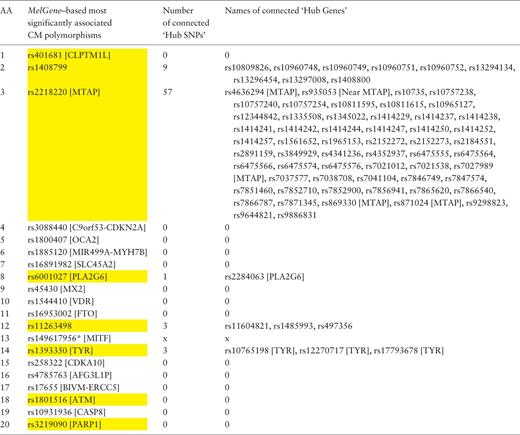
In a similar way, we examined the networks of single-nucleotide polymorphisms (SNPs) based on their DPrime value with proxy SNPs. Specifically, we found the SNPs acting as ‘hubs’ in these networks and investigated their relationship with the top 20 SNPs that correspond to the 20 MelGene top genes . Again, we calculated the four network centrality measures. The SNPs that present at least one network property value above μ + σ are considered to act as ‘hub’ SNPs. We merged the ‘hub’ SNPs derived from the four different metrics resulting in 607 unique ‘hub’ SNPs, eight of which belong to the top 20 SNPs of MelGene (rs401681, rs1408799, rs2218220, rs6001027, rs11263498, rs1393350, rs1801516 and rs3219090— Table 4 , highlighted in yellow). The SNP4Disease database ( http://snp4disease.mpi-bn.mpg. de/ ), which was developed by the Max Planck Institute for Heart and Lung Research and provides information on diseases linked to SNPs by literature-mining techniques from various sources, was used to find which of the 607 ‘hub’ SNPs have been implicated in CM. In all, 72 ‘hub’ SNPs have been linked to CM, seven of them belong to the top 20 SNPs. Furthermore, we examined whether the top 20 SNPs are connected with ‘hub’ SNPs in the DPrime network (rs14961795, located in MITF , was not found in SNP DPrime network and thus excluded from this list). Five of the top 20 SNPs interact with at least one ‘hub’ SNP (rs408799, rs2218220, rs6001027, rs1126349 and rs1393350) as shown in Table 4 .
Ranked list of the most significantly associated CM SNPs according to MelGene along with the number and the names of the interconnected ‘hub SNPs’ in the corresponding DPrime SNP network
 |
|
Yellow highlighted are those SNPs that act also as ‘hubs’. * Indicates that the specific SNP does not exist on the DPrime SNP network.
Ranked list of the most significantly associated CM SNPs according to MelGene along with the number and the names of the interconnected ‘hub SNPs’ in the corresponding DPrime SNP network
|
|
Yellow highlighted are those SNPs that act also as ‘hubs’. * Indicates that the specific SNP does not exist on the DPrime SNP network.
When exploring the 72 ‘hub’ SNPs that were implicated in CM by the SNP4Disease database in the polymorphism networks based on SNP DPrime values, we observed that four SNPs [rs2218220 (located in MTAP ), rs4636294 (located in MTAP ), rs854145 (located in GRM1 ) and rs935053 (located Near MTAP )] acted as ‘hubs’ based on three centrality measures (degree, closeness and betweenness centrality). We observed that one of these SNPs, i.e. rs854145 in GRM1 , is the most central polymorphism (see Figure 6 A). On the other hand, rs2218220, which is located in MTAP , belongs to the 20 most significant SNPs in the MelGene meta-analysis results. Finally, rs4636294 and rs935053 were also found as ‘hub’ SNPs from the three centrality metrics. As shown in Figure 6 B, they are also highly intercorrelated with rs2218220.
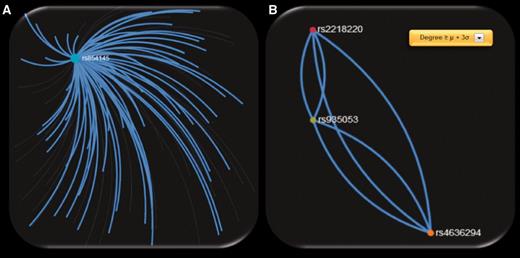
Screenshots of SNP networks created based on the DPrime SNP network of ( A ) rs854145 with no visualization filtering, ( B ) rs935053 with Degree ≥ μ + 3σ.
To highlight the most important ‘hub’ SNPs, we applied the same procedure but we considered as ‘hubs’ the SNPs that present at least one centrality measure above μ + 3σ. We obtained 256 ‘hub’ SNPs for the 4 centrality measures of which 2 are from the 20 most significant SNPs in the MelGene meta-analysis results (rs11263498 [located in CCND1 ] and rs2218220 [located in MTAP ]). From the 256 ‘hub’ SNPs, 21 are reported in the ‘SNP4Disease’ database in relation to CM. Strikingly, the 21 SNPs derived with more rigorous centrality filtering (at least one centrality measure above μ + 3σ) included again the same central polymorphisms (rs854145, rs2218220, rs4636294 and rs935053) found previously in the 72 ‘hub’ SNPs that were implicated in CM by the SNP4Disease database with at least one centrality measure above μ + σ.
In summary, by using several pipelines network-driven data exploration tools implemented in MelGene , we have identified seven genes from the MelGene database (none of which had sufficient association data to perform a meta-analysis in MelGene ) and four polymorphisms (of which three have not been meta-analyzed in MelGene because of lack of association data) that may play a potential role in CM pathophysiology ( Table 5 ).
List of genes and polymorphisms highlighted through network-driven analysis based on MelGene data that have not been meta-analyzed in MelGene beacuse of lack of sufficient data
| Gene | SNP | Study | Ethnicity | Population | Source | Number of melanoma cases | Number of controls | Major allele | Minor allele | Association with melanoma |
|---|---|---|---|---|---|---|---|---|---|---|
| PMEL (SILV) | rs1052206 | Fernandez, Hum. Mutat., 2008 | Caucasian | Spain | CL | 131 | 245 | T | C | NS |
| rs1052165 | Fernandez, Hum. Mutat., 2008 | Caucasian | Spain | CL | 131 | 245 | C | T | NS | |
| rs2069391 | Fernandez, Hum. Mutat., 2008 | Caucasian | Spain | CL | 131 | 245 | C | T | NS | |
| MLANA | rs2233178 (H17) | Fernandez, Exp. Dermatol., 2009 | Caucasian | Spain | CL | 205 | 245 | C | T | NS |
| TP53 | rs1042522 | Nan, Br. J. Dermatol., 2008 | mixed | USA | NHS | 211 | 850 | C | G | P |
| Povey, Carcinogenesis, 2007 | Caucasian | UK | CL cases / PO controls | 538 | 425 | C | G | NS | ||
| Stefanaki, Br. J. Dermatol., 2007 | Caucasian | Greece | CL | 107 | 145 | C | G | P | ||
| Han, Mol. Carcinog., 2006 | mixed | USA | NHS | NA | NA | NA | NA | NA | ||
| Gwosdz, Int. J. Cancer, 2006 | Caucasian | Germany | CL cases / blood donors controls | 49 | 193 | C | G | P | ||
| Shen, J. Invest. Dermatol., 2003 | Caucasian | USA | CL | NA | NA | NA | NA | NA | ||
| Bastiaens, Mol. Carcinog., 2001 | Caucasian | The Netherlands | CL | 120 | 157 | C | G | NS | ||
| Capasso, J. Hum. Genet., 2010 | Caucasian | Italy | CL | 240 | 284 | C | G | NS | ||
| Li, J. Invest. Dermatol., 2008 | Caucasian | USA | CL | 805 | 838 | C | G | P | ||
| ITGA7 | rs1800974 | Lenci, Mutagenesis, 2012 | Caucasian | Germany | CL | 757 | 736 | G | A | NS |
| ITGA9 | rs267561 | Lenci, Mutagenesis, 2012 | Caucasian | Germany | CL | 757 | 736 | G | A | NS |
| ITGB2 | ||||||||||
| HLA-A | HLA-A*01, HLA-A*02, HLA-A*03, HLA-A*11, HLA-A*23, HLA-A*24, HLA-A*25, HLA-A*26, HLA-A*28, HLA-A*29, HLA-A*30, HLA-A*31, HLA-A*32, HLA-A*33, HLA-A*34, HLA-A*66, HLA-A*00 | Campillo, Immunogenetics, 2006 | Caucasian | Spain | CL cases / PO controls | 174 | 227 | NA | NA | NS |
| HLA-A*01, HLA-A*02, HLA-A*03, HLA-A*11, HLA-A*23, HLA-A*24, HLA-A*25, HLA-A*26, HLA-A*29, HLA-A*30, HLA-A*31, HLA-A*32, HLA-A*33, HLA-A*36, HLA-A*68, HLA-A*69, HLA-A*80 | Naumova, Cancer Immunol Immunother., 2005 | Caucasian | Bulgaria | PO | 50 | 54 | NA | NA | NS | |
| HLA-A*01 | Luongo, Tissue Antigens, 2004 | Caucasian | Italy | CL cases / PO controls | 382 | 203 | NA | NA | NS | |
| GRM1 | rs854145 | Ortiz, Eur. J. Hum. Genet., 2007 | Caucasian | Spain | CL | 250 | 329 | T | C | NS |
| MTAP | rs4636294 | Bishop, Nat. Genet., 2009 | Caucasian | Genome-wide phase_ Australia, UK, France, Italy, Spain, Sweden. | PO | 1539 | 3917 | A | G | P |
| Bishop, Nat. Genet., 2009 | Caucasian | Replication GenoMEL (REP1) | PO | NA | NA | NA | NA | NA | ||
| Bishop, Nat. Genet., 2009 | Caucasian | Replication Leeds (REP2) | PO | NA | NA | NA | NA | NA | ||
| Caucasian | Australia_Q-MEGA | PO | 1734 | 1811 | A | G | P | |||
| Caucasian | UK_Leeds2 | PO | 1397 | 2465 | A | G | P | |||
| MTAP region | Caucasian | Greece | CL | 284 | 284 | A | G | NA | ||
| GWA_rs935053 | rs935053 | Bishop, Nat. Genet., 2009 | Caucasian | Genome-wide phase_ Australia, UK, France, Italy, Spain, Sweden. | PO | 1539 | 3917 | G | A | NS |
| Bishop, Nat. Genet., 2009 | Caucasian | Replication GenoMEL (REP1) | PO | 1149 | 964 | G | A | NA | ||
| Bishop, Nat. Genet., 2009 | Caucasian | Replication Leeds (REP2) | PO | 1163 | 903 | G | A | NA | ||
| Near MTAP | Amos, Hum. Mol. Genet., 2011 | Caucasian | USA_MD Anderson Cancer Center | CL | 1804 | 1026 | G | A | P |
Source : ‘CL’ (clinic based), ‘PO’ (population based), ‘NHS’ (Nurses Health Study), ‘HPFS’ (Health Professionals Follow-up Study).
Association with Melanoma: Overall conclusion reached by authors of the original publication (‘P’ indicates significant ( P < 0.05) association in at least one of the performed analyses, and ‘NS’ indicates nonsignificant association); results obtained in duplicate or largely overlapping samples are listed as ‘NA’.
Conclusion and future work
We present here the new re-designed version of the MelGene database empowered with network analysis tools that has led to the identification of known and several new promising genes implicated in melanoma pathophysiology. MelGene serves as a comprehensive reference repository for genetic association data in CM and can provide further insights in the predisposition of CM by systems biology approaches.
In the future, it is planned to further expanding the MelGene database by curating our data set with new small- and large-scale genetic association studies in regular time intervals. In addition, our database can be expanded so as to include and integrate more data in the future including somatic mutations in melanoma from publicly available databases such as the COSMIC database ( 22 ), as well as more and of different types of pre-compiled relationship networks.
Funding
This research has been co-financed by the European Union (European Social Fund – ESF) and Greek national funds through the Operational Program ‘Education and Lifelong Learning’ of the National Strategic Reference Framework (NSRF) - Research Funding Program: Aristeia I - 1094. The funders had no role in study design, data collection and analysis, decision to publish, or preparation of the manuscript.
Conflict of interest . None declared.
References
Author notes
Citation details: Athanasiadis,E.I., Antonopoulou,K., Chatzinasiou,F., et al . A Web-based database of genetic association studies in cutaneous melanoma enhanced with network-driven data exploration tools. Database (2014) Vol. 2014: article ID bau101; doi:10.1093/database/bau101.
