


Abstract
Systems biology analysis of protein modules is important for understanding the functional relationships between proteins in the interactome. Here, we present a comprehensive database named AIM for Arabidopsis (Arabidopsis thaliana) interactome modules. The database contains almost 250 000 modules that were generated using multiple analysis methods and integration of microarray expression data. All the modules in AIM are well annotated using multiple gene function knowledge databases. AIM provides a user-friendly interface for different types of searches and offers a powerful graphical viewer for displaying module networks linked to the enrichment annotation terms. Both interactive Venn diagram and power graph viewer are integrated into the database for easy comparison of modules. In addition, predicted interologs from other plant species (homologous proteins from different species that share a conserved interaction module) are available for each Arabidopsis module. AIM is a powerful systems biology platform for obtaining valuable insights into the function of proteins in Arabidopsis and other plants using the modules of the Arabidopsis interactome.
Database URL:http://probes.pw.usda.gov/AIM
Introduction
The interactome represents the complete set of molecular interactions in a particular cell (1). Because cellular processes are not typically carried out by individual proteins, interactomes play a very important role for understanding the biological regulatory mechanisms. With the data availability from different high throughput experimental approaches, such as yeast two hybrid screens, mass spectrometry and protein microarrays, large amounts of protein interaction data can be obtained and analyzed comprehensively. Moreover, several powerful bioinformatics methods, such as co-expression analysis, text mining and ortholog interaction prediction, have been developed to assist in the global interactome analysis, making the interactome data more massive and complicated. It is well established that densely interconnected regions of an interactome often correspond to functionally related groups of proteins that can be identified as modules (2). Despite the increasing number of interactions in the interactome, it is difficult to gain an understanding of a given protein’s function without knowing the module construction and function. To study specific biological processes, the interactome is frequently studied through protein modules (3).
Large-scale interactome data have provided maps of molecular networks for several organisms (4–7). A number of studies have been undertaken to identify modules, which might represent protein complexes or signaling pathways, from interactome networks (8–10). Among plants, Arabidopsis (Arabidopsis thaliana) is the only species for which a globally applicable interactome has been constructed (11). A number of Arabidopsis interactome databases were generated using experimental and prediction methods (12). These databases allow users to extract protein interactions along with the interaction annotations. Most of the available databases focus on the interactions between the query proteins and their neighbors; however, there is no unified resource that combines a wide variety of sources and extensive functional annotations, thereby, providing a comprehensive database for biologists to investigate the modules in the context of the Arabidopsis interactome. GeneMANIA can show a subnetwork based on the query list and interactome data (13), but its focus is not on module annotation and comparison. A database named PINA is well known for mining interactome modules (14); however, module information on Arabidopsis is not as comprehensive, and the result is not integrated into web interface for easy analysis and display.
Here, we report the development of AIM, an Arabidopsis interaction module database that contains integrated interactome datasets and different clustering algorithms to identify collections of modules. AIM has a flexible, user-friendly web interface for analyzing possible gene functions by identifying interacting protein components in the modules through a simple query search. The Arabidopsis interactome modules are augmented by combining the results from multiple interaction datasets and by integrating gene expression data as well as providing a thorough informative annotation. We also implement a method to identify potential interologs in other plant species using the Arabidopsis interactome network. Thus, the AIM platform can be used to swiftly infer similar modules across several other plant species and can predict the identity of functional homologs. We believe that the AIM database will provide valuable information for plant researchers analyzing interaction modules and aide in the elucidation of the biological functions of proteins.
Database construction
Data collection
A significant amount of protein interaction data has been generated for Arabidopsis, but the interactions have been produced using different analysis methods and stored in different databases (12). To generate the modules, an integrated knowledge interactome dataset for Arabidopsis is necessary. We downloaded all the interactions in ANAP (15), which was integrated from 11 public Arabidopsis protein interaction databases, and used these interactions to gain information about modules (see sections below). Because gene and protein expression data can add information about which parts of a network are active in a given condition, we also downloaded the Arabidopsis gene expression experiments from the ArrayExpress archive (16). Raw expression data from each Affymetrix microarray experiment were pre-processed in R. The limma (17) Bioconductor package was used to discover differentially expressed genes (DEG).
Module identification and function annotation
In the AIM database, multiple methods and integrated expression data were used to curate different modules from the Arabidopsis interactome as follows:
(i) Extracting modules based on interactome topological structure (Figure 1A).
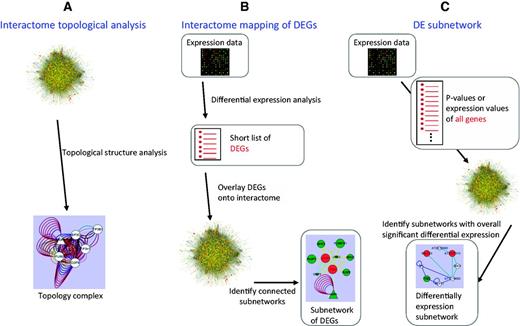
The methods used for identifying interactome modules in the AIM database.
To have functions in complex biochemical or developmental pathways, protein modules exhibit specific topological structures in the interactome network. Several algorithms have been developed to identify highly interconnected groups of nodes within a network, we selected three methods, CORE (core-attachment based method) (18), MCL (Markov clustering) (19) and MCODE (molecular complex detection) (8). After executing these methods, we removed modules containing <5 proteins and obtained 1290 modules.
(ii) Identifying modules based on interactome mapping of DEG (Figure 1B).
Proteins that interact with each other can be expected to be activated and repressed under the same conditions. Therefore, the DEG data can add information about the parts of a network that are active in a given condition. In the AIM database, we mapped the Arabidopsis expression data obtained from different experimental conditions to the interactome to generate a DEG network. The DEG modules were identified from the DEG network based on the algorithms mentioned in (i). A total of 178 791 modules were detected from 440 expression experiments that contained 2195 conditions.
(iii) Discovering modules based on the differential expression (DE) subnetwork (Figure 1C).
A DE subnetwork is obtained by combining the interactome network and the expression data. Unlike DEG interactome mapping, the expression information of all the genes is used. Although some genes are not differentially expressed, they can be included in the deregulated subnetwork if they are interconnected with many DEGs. DE subnetwork analysis has the potential to detect more subtle active modules. Although many algorithms can identify a DE subnetwork, most of them are very slow to analyze big datasets. Thus, to perform our DE subnetwork analysis of the large Arabidopsis interactome integrated with the many available expression datasets, we selected two of the most efficient analysis methods, Heuristic (20) and GiGA (21). Through these analyses, we obtained 64 172 modules.
Interolog module in other plants
In plants, only Arabidopsis has large-scale interactome networks, therefore, the transfer of interaction annotation from Arabidopsis to other plant species is of significant value in understanding the similarity or divergence of protein functions in different plant species. To predict potential interologs, we first used BLAST to identify homologous genes in the eudicots: Glycine max, Medicago truncatula, Populus trichocarpa, Vitis vinifera and in the monocots: Brachypodium distachyon, Oryza sativa, Sorghum bicodor and Zea mays. The sequence data of these species were downloaded from Phytozome v10 database (25). Then, if interacting proteins A and B in Arabidopsis have interacting orthologs A′ and B′ in another plant species, the pair of interactions A′–B′ were extracted, which are called interologs (26). In the AIM database, we generated putative interologs for each Arabidopsis module in the database for the selected eight species.
Utility and web interface
Search system
There are three ways to utilize the interactome modules in the AIM database. One way is a gene identifier or gene symbol search that users can perform to find modules. The main page of the search results lists all the modules meeting the search criteria and provides brief information, such as module identifier, module thumbnail, node number, edge number, module collection, top annotation and predicted interologs (Figure 2). The second way to find modules is to perform a keyword search across different microarray experiments. The search result delineates ID, description, array number and different experimental conditions that link to the identified modules in the expression experiment. The third way to search for modules is to filter by annotation. In the AIM database, more than 25 000 000 significant annotation terms for modules are recorded, allowing for the filtering of modules according to user-specific interests.
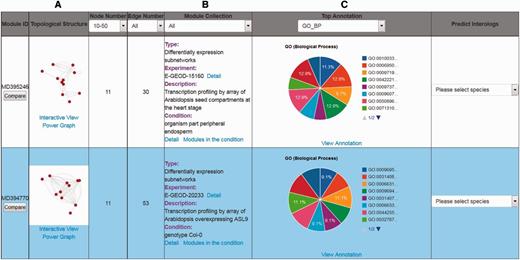
An example of search results for the top two modules. (A) The link underlying the thumbnail image will launch the interactive visualization tool and power graph viewer. (B) Description of the module information. (C) The interactive pie chart summarizing a top annotation distribution for the module.
Interactive module viewer
AIM uses the Cytoscape Web application (27) for visualizing and manipulating the graphs of the interactions in the module network. The network can be panned and zoomed in different layouts, and the ID of query proteins is marked in red in the center of the figure, and each associated protein is linked by a uniquely colored line based on the interaction detection method. For modules in the expression experiment, red nodes represent up-regulated expression and green indicates down-regulated expression, different node size means the level of the DE (Figure 3A). The information of all the nodes and edges is shown in the properties panel and users can customize their size and color. Various interactive options are available, such as to highlight the proteins in the network with a significant term from different database in the annotation panel, or filter nodes or edges based on their characteristics in the filter panel (Figure 3A). Combining these options with the other filtering options provides a quick and powerful way to explore the module. In addition, the users can export the module network as XGMML, GraphML and SIF file for other network tools for subsequent additional analysis. The module network also can be saved as different image format such as SVG, PDF and PNG.
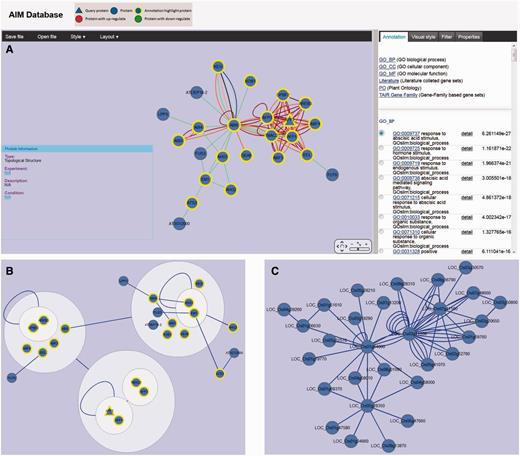
Viewer and network analysis tools. (A) Module (MT779) viewer with various interactive options including highlighting the proteins in the network with a significant term, filtering nodes or edges and modifying display parameters. (B) MT779 with power graph representation. (C) Predicted interologs for MT779 in rice.
Power graph analysis
Power graph analysis (PGA) is a lossless transformation of biological networks into a compact, less redundant representation, exploiting the abundance of cliques and bicliques as elementary topological motifs (28). In the AIM database, each module can be reformulated using the PGA method. Power graph representation of the module is converted to compound nodes (i.e. nodes within nodes), which is easy to display in the Cytoscape web. The interactive module viewer allows users to integrate the module annotation with the cluster which is presented in the PGA result (Figure 3B). With complicated modules, PGA thus provides useful hints into the existence of complexes within a module including their internal organization and their relationships.
Homolog modules
As biological interaction networks are conserved at the module level, it is useful to infer likely protein interaction networks in other species based on a comparison with Arabidopsis (29). In the AIM database, users can easily identify potential interologs in eight other plant species. For each Arabidopsis module, the potential interologs in the homologous module from another species can be displayed in the same interactive module viewer as described in previous section (Figure 3C). On the AIM homepage, users also can query the neighbor nodes in the whole predicted interolog network using the gene identifier of interest.
Venn of module comparison
In the AIM database, each module can be compared with other modules, which can show the conserved nodes in the modules and changes of functional components in different conditions. We developed an efficient module comparison tool, which provides a Venn diagram view for comparing two to four modules at a time. Two Arabidopsis AFP2 (ABI FIVE BINDING PROTEIN 2) modules (AM606236 and AM604130) are shown in Figure 4A and B. The interaction prediction methods linking each node in these modules are annotated on the edges shown in the diagrams illustrating that there is significant evidence linking each of these proteins to the other proteins in the module (Figure 4A and B). Although this information is not typically displayed on the module edges, it is available under the properties tab by selecting an edge in the interactive module viewer. The diagram view of the comparison of these two related modules is an interactive Venn diagram showing the number of nodes in each grouping (Figure 4C). Clicking on any area in the diagram selects the corresponding nodes in the current comparison modules network view. The Venn diagram view uses a symmetrical layout that supports two to four modules. The Venn diagram views for two and three modules use two and three circles, respectively. For four modules, a symmetrical construction of four ellipses is used.
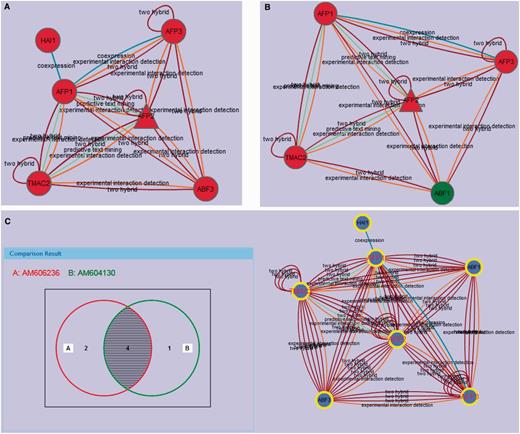
(A) The active module (AM606236) with up-regulated AFP2 in the ABA treatment condition. The interaction prediction methods used are annotated as identified in the properties tab. (B) The active module (AM604130) with up-regulated AFP2 in the drought condition. (C) AM606236 and AM604130 comparison with Venn. Protein nodes highlighted with yellow border are related with abscisic acid mediated signaling pathway (GO:0009738). The shared proteins in the three modules are highlighted with red labels.
Example
A case study we present here is the analysis of AFP2, which belongs to a member of a small plant-specific gene family that interacts with ABA-Insensitive 5 (ABI5) (30). In the AIM database, the largest module based on the topology containing AFP2 is MT779 which has 24 nodes and 97 edges, generated by the MCL Method (Figure 3A). The top function annotation of the module is its response to abscisic acid stimulus (GO:0009737), while other hormone and endogenous stimuli are also involved with the module (Supplementary Figure S1A). Significant literature annotation confirms the analysis result in the AIM database (Supplementary Figure S1B). In addition, the module is not only related to seed development but also is potentially involved in leaf and flower development (Supplementary Figure S1C). To further analyze and better display the module topology, a PGA presentation (Figure 3B) can be selected showing that nodes are clustered by connectivity and neighborhood similarity. AFP2 is now shown to interact with other AFP family members (AFP1, AFP3) in the module, suggesting that AFPs may regulate themselves using a feedback loop through protein interactions. As the function of the AFP family is conserved in the course of evolution, a similar module that may play similar functions in response to abscisic acid signaling can be predicted in rice (Figure 3C). Two active modules containing AFP2 were identified by using expression data (Figure 4A and B). This result implies that the AFP genes play their roles by an up-regulation of expression and a feedback loop structure in response to ABA treatment and drought. Figure 4C shows the comparison result of these two modules. The two modules when merged, generated a subnetwork that is associated with the abscisic acid mediated signaling pathway (GO:0009738). The two modules share four proteins, AFP1, AFP2, AFP3 and TMAC2. It is interesting to note that the three AFP proteins present in the module have been shown to act together, suggesting that AFP proteins may group together and form a network linked via environmental stress.
Discussion
Interactome analysis is important for understanding the functions of proteins in the biological processes of living organisms. A common approach to discern structure in a global interactome network is to infer modules and assume a functional coherence within each module, which may represent a biological complex or a metabolic/signaling pathway. In the AIM database, we seamlessly integrate interactome modules and the associated functional annotations with a user-friendly network view.
The example section shown demonstrates that the AIM database provides a comprehensive tool enabling users to easily gain complex biological information associated with specific protein(s), thereby facilitating the design of research approaches for system biology studies in Arabidopsis. In addition, the AIM database includes related interologs from eight plant species that currently have limited amounts of protein interaction data available in the literature. Therefore, AIM can provide predicted modules in these other species based on the knowledge gained from Arabidopsis. This information is very useful for understanding the conservation and diversification of modules in different plant species through validation experiments. In the future, we will expand interologs from more plant species including additional agronomically and economically important crops species. In addition, as new interaction and expression data in Arabidopsis will become available in the future, we plan to update the AIM database every half year with our semiautomatic modules finding pipeline as stated in the text.
Acknowledgements
We thank Xiaohua He for the critical reading of the manuscript. We are very grateful to these anonymous reviewers for testing the server and offering valuable comments.
Funding
US National Science Foundation (grant number IOS 0822100) and US Department of Agriculture, Agriculture Research Service CRIS project 5325-21000-014. Funding open access charge: 0822100.
Conflict of interest. None declared.
References
Author notes
Citation details: Wang,Y., Thilmony,R., Zhao,Y., et al. AIM: a comprehensive Arabidopsis interactome module database and related interologs in plants. Database (2014) Vol. 2014: article ID bau117; doi:10.1093/database/bau117
